Ethics and Model Governance
This chapter provides a detailed overview of Model Risk Management (MRM) and the best practices for governance in organizations to reduce costs and increase efficiency. The primary objective of this chapter is to demonstrate MRM techniques by ensuring adherence to the right model metrics, along with using tools from both the model and data perspectives that can enable us to nurture the right risk mitigation and governance practices. You’ll learn how designing and formulating risk management scorecards can help prevent businesses from losing additional money.
In addition, this chapter highlights how the right tactics and knowledge of data or model change patterns are effective in identifying a model’s risks. This enables us to quantify the risks of models deployed in production and that reside in the model inventory. This chapter also explains how a large inventory of models running multiple experiments can be better managed and shared among teams collaboratively.
In this chapter, these topics will be covered in the following sections:
- Model Risk Management (MRM)
- Model version control
- Introduction to feature stores
Technical requirements
This chapter requires you to have Python 3.8, along with installing the following:
pipinstall wandb- Install Docker from https://docs.docker.com/desktop
gitclone(https://github.com/VertaAI/modeldb.git):docker-compose -fdocker-compose-all.yaml uppipinstall vertapipinstall feastpipinstall wandb
The code for this chapter can be found on GitHub: https://github.com/PacktPublishing/Designing-Models-for-Responsible-AI/tree/main/Chapter10.
Model Risk Management (MRM)
In this section, let us first discuss why it is necessary to develop a concrete framework for risk in models, which was first proposed by top institutions and the financial industry. This has enabled additional controls to be applied for MRM by banks and insurers. However, this can be extended and applied to other industry sectors (such as retail, media, and entertainment), which have widely adopted continuous monitoring and model retraining pipelines as a result of the huge volume of transactions happening every day. Although we will examine a real-world use case from the financial sector, organizations and leadership should strive to adopt these recommendations in any AI offerings and services, as AI guidelines, laws, and regulations have become more stringent.
Now that we understand how important model inventory risk management is, let us take a brief look at how model inventories can be managed. Model inventory management is a subsection of MRM. So let us learn about its types.
Types of model inventory management
Model cataloging and versioning for production are provided by AWS, which supports model inventory management, as detailed here. The model registry associates metadata with a model, along with its training metrics, owner name, and approval status:
- A distributed model inventory management approach: This method allows model files and artifacts to be stored in the same account that they are generated in. Furthermore, the model is registered in the SageMaker Model Registry linked to each account. Hence, any business unit is free to have its own ML test account to perform User Acceptance Testing (UAT), and the models generated by the training process are allowed to be registered and kept in the business unit’s own UAT/test account.
- A central model inventory management approach: This method allows all generated models to be stored in the Shared Services account, along with the associated inference Docker container images. Further, the versioning process is enabled by a model package group. Any production deployment/upgrade of a model in the production account is facilitated with versioning through an Amazon Resource Name (ARN) from the central model package repository.
The Supervisory Guidance on Model Risk Management (SR 11-7) was published in April 2011 by the Board of Governors of the Federal Reserve System. This document conceptualizes the idea of model risk and has become the standard in the industry. It sets down the invariable risks present in the models and the adverse consequences that may arise at any stage of the model development life cycle due to decisions based on incorrect or misused model outputs and reports.
The document also highlights the importance of decision-makers understanding the limitations of a model and refraining from using a model in areas that it was not intended for. With the quantification of model risk came the European Banking Authority’s Supervisory Review and Evaluation Process, which stipulates that model risk should be identified, mapped, tested, and reviewed so that institutions can quantify the market risk to capital. It also provides the flexibility of allocating a specific budget when the actual capital amount for a specific risk cannot be quantified.
When formulating model risk, there has been awareness among authorities of considering risk during their assessments to streamline them. Action needs to be taken when different operational risks affect businesses due to the use of predictive models, as stated:
- Risks are generated when organizations or banks underestimate their own funds by using regulatory-approved models. Examples of this are more visible in Internal Ratings-Based (IRB) models for credit risk and capital adequacy assessment.
- Risks are linked to a lack of knowledge and the improper use of models when pricing products and evaluating financial instruments.
Let’s see the potential savings MRM offers.
Cost savings with MRM
MRM primarily aims to reduce costs and prevent losses by increasing operational and process efficiency in building, validating, and deploying models, where ineffective models are eliminated. In addition to cost reduction comes capital improvement because of the reduction in undue capital buffers and add-ons. A well-defined MRM function often gives regulators confidence and reduces penalties, also avoiding expenditure on the costs of noncompliance. MRM clearly produces a tangible improvement in Profit and Loss (P&L), as modeling costs are reduced (in the order of millions) when fragmented model ownership is addressed. Complex models are replaced and more interpretable versions are added and assigned to the right business units. Research results reveal a global bank spent an additional €44 million, up from €7 million (yielding a total of €51 million) in four years, showing a nearly sevenfold increase in the capital budget spent on models. Thanks to the MRM framework, banks gain confidence in the existing model landscape, which helps them to align investing in models with business risks and their priorities and reduce P&L volatility. This not only places the focus on the transparency of models but also gives them a way to nurture an institutional risk culture. Then, cost savings free up resources and funds that can be allocated to high-priority decision-making models.
The advantage of a defined and structured approach to MRM is that it reduces ML development costs by 20-30%. This has made banks increasingly cautious about the risks arising from improper model use and has instead caused them to concentrate on their model validation budget to optimize the model inventory with higher quality, consistency, and resilience. Another important factor that has been increasingly taken into account is risk identification based on the priority of business decisions. Here, we can see the emergence of the concept of model risk classification techniques (also known as tiers), which can further boost speed and efficiency by strategizing the use of resources and establishing strong governance.
In the financial industry, the use of AI/ML-driven solutions and automation has had a huge impact on managing customer relationships with the bank. Portfolio management and optimization have demonstrated 25% reductions in costs for businesses by reducing inefficiency using validation plans, processes, and matrices. Testing and coding costs also note substantial savings of 25% by automating well-defined and repetitive validation tasks. Mechanisms such as standardized testing and model replication have also been introduced.
Figure 10.1 illustrates the five cornerstones of model risk, which are as follows:
- Model definition
- Model governance
- Model validation
- Operational risk
- Model calibration
They can be seen here organized into a diagram:
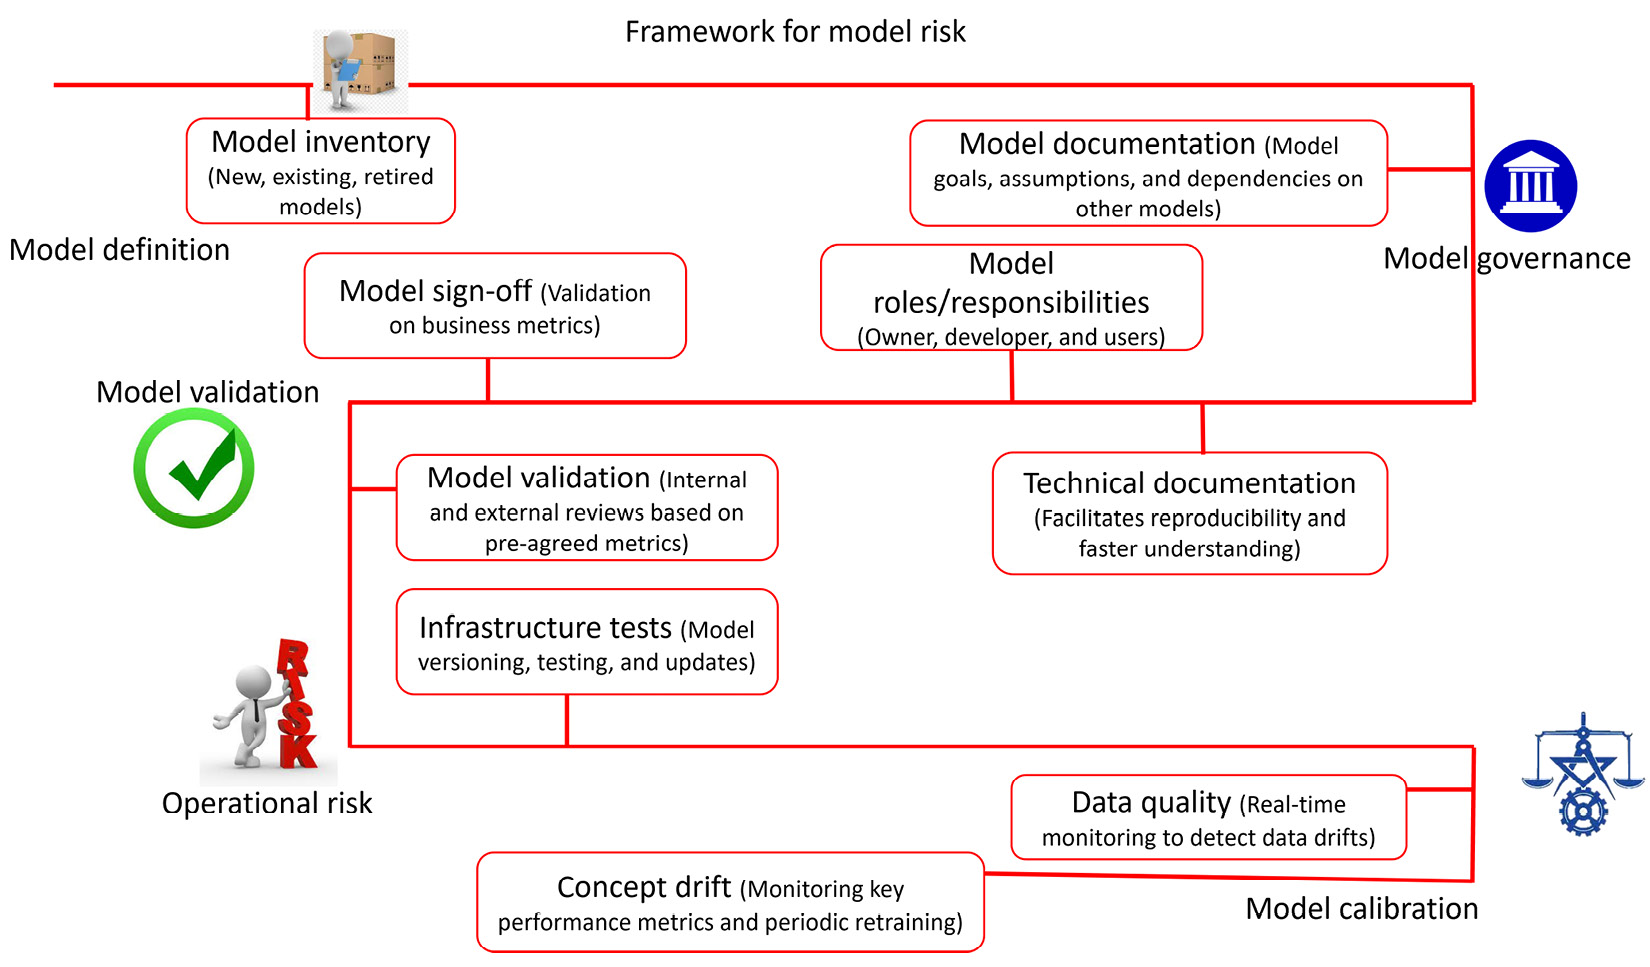
Figure 10.1 – The four pillars of the MRM framework
Each model definition of retired, new, and existing models is stored in the model inventory. The model inventory contains all the terms relating to it to give stakeholders a high-level overview of what a model does and what its limitations are. A model inventory stores all of the ML models that are running in production and allows us to create a dependency tree showing how they interact with each other.
It therefore helps to map out which models have the most inherent risk, primarily due to potential cascading failures.
The model inventory includes the model name and description, the development stage (currently in use, under development, or recently retired), a high-level risk assessment, the goals for the model, assumptions about it and its limitations, its volume, the context of its use, and its financial impact. Model inventories often go stale over time; hence, the best way to manage inventories is to assign the responsibility to a cloud/DevOps engineer who is assigned the responsibility of model inventory management and works in close coordination with model owners to ensure each model’s documentation is up to date. The documentation also provides evidence of due diligence during the creation of the model and details the outcome of validation.
Model governance involves all the activities and details related to policy, controls, versions, roles and responsibilities, documentation, measurement processes, reporting, notifications, in-depth details on models, risk ratings to justify the goals of a model, the objectives and limitations of models, and their dependencies on other models. As model governance controls the model version and role changes, it is also responsible for quantifying the aggregation of risk for models, for successive released versions of the models. In addition, all activities performed by the model also fall within the perimeter of model governance. As such, it includes all information that relates to the change control process, the foremost challenges, the use of vendors, stakeholder credentials, life cycle processes, and the interpretation of regulations. The formalization of the MRM strategy available in SR 11-7 suggests that banks focus on “testing and analysis with a key goal of promoting accuracy” (https://www.afponline.org/ideas-inspiration/topics/articles/Details/model-governance-and-model-risk-management).
The following lines of action are suggested for segregating roles and responsibilities:
- Establish second and third lines of defense with senior management, model developers, and model validators with proper documentation on the composition of teams. This is to provide a mandate and reporting lines for the committees responsible for internal model governance and oversight, even when teams change as ML models change.
- The model owner is responsible for the model’s development, implementation, and use. They work in close coordination with senior management to define a sign-off policy for deploying new models.
- The model developers follow the lead of the model owner to create and implement the ML models.
- The model users can belong to internal teams that align with the business or external teams whose needs and expectations are well understood. They can also get involved in the development of the model to validate the model’s assumptions during training.
- Chart out your organization, including external resources that can quickly identify and mitigate performance issues related to model uncertainties and deficiencies.
The model validation process not only involves the model performance metrics but also all the details pertaining to the design process, data assessment methodologies used, model testing, and documentation (what is actually documented). This is a kind of audit step that ensures the performance of the model complies with the input data and processes mentioned in the document.
During model validation, the degree to which the model is used is compared to the intended model use, which helps us to decide the risk rating; its limitations enable us to further tweak and record the design controls. All information relating to the processes of programming, incorporating the model into the network, testing the implementation standards, benchmarking, and the error process for each model are verified during the validation stage.
Organizations can choose to define internal and external validation processes to ensure models meet the desired performance benchmarks before they are deployed. A two-party validation strategy can be brought about by incorporating external validation (where validation is performed by an external auditor or an independent party) and internal validation (where validation is carried out by the same team or division). Although validation is most often carried out by internal teams, regulators require external validation. The objective of validation is to reveal bias, edge cases, or gaps in the documentation, model building, or versioning to pinpoint cases that have not been considered without taking input from the model owner on board.
Operational risk identifies all the steps that govern running model infrastructure tests, model versioning, running different test strategies, and retraining or updating the models. It not only quantifies risks emerging due to inherent problems in the data on which the model is trained or its dependency on another model but also highlights problems arising from risks in the production environment due to microservices, latency, and the threat of Distributed Denial of Service (DDoS).
Model calibration tweaks models, their timing, and the features that suggest the model needs to be retrained and recalibrated and gauges their explainability with the required documentation. In addition, it also demonstrates the reasons, such as data and concept drifts, as determined by monitoring tools, why the model is recalibrated. It handles the model follow-up scheme to remedy deviation from the desired outcomes of the model or model misuse immediately after these problems are detected. This necessitates employing a constant model monitoring tool to detect and address potential issues, which can help keep conditions and performance consistent and reproducible in spite of changes of any kind to the input or dependencies of the model.
Now, let us see how an organization can evolve its MRM framework over subsequent phases of the model development life cycle.
A transformative journey with MRM
The journey from the inception of MRM to transformative and differentiated steps travels through three distinct phases. As illustrated in Figure 10.2, the MRM design framework has the following stages:
- The foundational phase: This stage sets up the MRM policy, model inventory, a basic model workflow tool, and the model governance standards.
- The maturity phase with implementation and execution: The MRM framework is applied at scale to a large number of complex ML models. This phase also requires stakeholder training and the implementation of an automated workflow tool that defines the data lineage, model governance, and other controls and processes in its life cycle.
- Transformation/differentiation with value: This phase involves research and the development of MRM within a center of excellence with industrialized validation, transparency, process efficiency, and optimized use of resources.
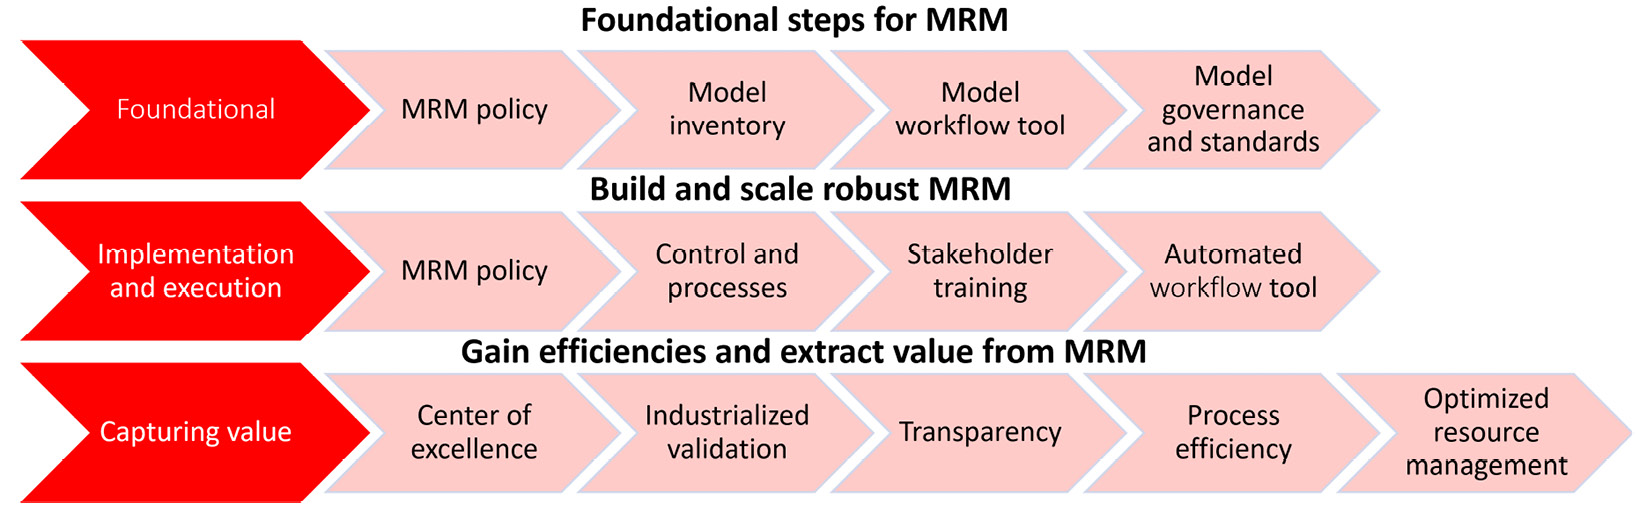
Figure 10.2 – Implementing MRM as a practice
Now that we have learned about the MRM framework and how we enhance it, let’s learn about two important tools that can aid in model risk tiering. The majority of the model risk tiering tools and techniques described in this chapter are inspired by and/or adapted from Model risk tiering: an exploration of industry practices and principles (https://www.risk.net/journal-of-risk-model-validation/6710566/model-risk-tiering-an-exploration-of-industry-practices-and-principles).
Model risk tiering
Model risk tiering, expressed in absolute terms, is an abstract external demonstration of model inventory risks that identifies and differentiates the risks presented by one model’s use compared with the risks presented by other models. The assessment metric is an important parameter for consideration in businesses (especially in banks) that determines and contrasts the model risks for a single business use case and reflects the seriousness of any problems. This is directly dependent on how we evaluate the model inventory and define the risk classification factors. It is closely associated with other external and internal factors of the business, market conditions, and other financial risk factors that sort the models based on their increasing order of importance.
For example, size, complexity, yearly/quarterly revenue, and the volume of capital involved all have a role to play in designing customized MRM frameworks across all departments of an organization. For example, a regional bank with $1 billion in assets will differ in customer engagement, ML model behavior, exposure, and complexity from a larger bank with assets worth $1 trillion.
If these factors are taken into consideration, this helps to balance the hierarchical structure of MRM based on the purpose of the business. These business-driven needs lead to the weighing of models into high-risk-tier, medium-risk-tier, and low-risk-tier models that can be framed to co-exist within a robust MRM framework for small as well as large and complex firms.
A model risk tiering tool helps to carve out the materiality (which signifies the model risk based on volume, context of use, and financial impact) and complexity of models by taking into consideration the model’s impact on and significance to enterprise decisions. The output model’s decisions and the quality of models also have an important role to play. The model tiering process also aids in model risk prioritization by defining its ranks based on the priority criteria (laid down by the business) of the model metrics. The design and choice of model risk tiering tools are based on a few principles:
- Expert judgment is the main driver of the design of a classification tool that empirically quantifies, assesses, and orders model risks. It propels the tool’s working philosophy and is driven by business and functional decisions.
- A model risk tiering tool should be simple to use and transparent and provide consistent, reliable, unbiased results by broadly classifying all the models in the inventory.
- It places more emphasis on a model’s inherent risk than a model’s residual risk. Here, inherent risk refers to model risk and capital costs arising from the presence of old model validation techniques, the total absence of model validation methods, or unaddressed issues. A model’s residual risk primarily refers to the current model’s risk when compared with other models in the organization’s inventory.
- The model risk category educates the data stakeholders on the relative risk present in the model and the risk indirectly levied by predictions across varying tiers labeled by the tool.
- The design process of the model risk tiering tool should allow teams to strongly correlate and link the relative risk present within models across business units and legal entities within the organization.
- The model risk classification design process should generate and explain results that are aligned with management expectations and business outcomes. The tool should be able to explain the outcomes with varying weight factors for all the models in the inventory.
Model risk tiering provides a significant benefit to organizations where key stakeholders are aware of the business losses due to failures of models in different tiers. This may include the following:
- You can estimate and assess the impact that the model has on the current (book or market) value. The financial impact can be further quantified using the unit (dollar value) of the predicted outcomes, as well as the unit (dollar value) of the entities modeled.
- You can factor in potential business losses (such as losing customers due to changes in demand) due to model errors that are caused by its sensitivity in terms of the input features. The computed risk metrics can often highlight the sensitivity of models due to external volatility.
- You can understand the impact of the volume of customers directly or indirectly consuming the predicted outcomes of the modeled entity, or the number of entities being modeled.
- You can analyze the dependence of the model based on the results and assess the impact on the business.
Now, let’s look at the different types of risk classification tools available.
Model risk trees
Model Risk Tree (MRT), first brought about by Mankotia and Joshi (2013), as illustrated in Figure 10.3, follows a decision tree approach to classification to evaluate the different dimensions of model use. This is a two-fold process, which makes it transparent and easy to understand. It takes into consideration different exposure thresholds to label and categorize a model as high risk, moderate risk, or low risk.
At the first level of the tree, the dimension assesses whether the model quantifies risk, delays, timing, prices, or any other value – an indicator specifying the overall risk of the model’s domain coverage. This paves the way for further classification categories. The answer “no” leads to the conclusion that the model belongs to a low-risk tier, whereas an answer of “yes” compels movement to the next stage. The next evaluation metric tries to ascertain the model use dimension to determine the use of the model either in critical decision-making or regulatory or financial reporting. If the answer is “yes,” the model is marked as belonging to a high-risk or moderate-risk tier, whereas “no” culminates in marking the model as in the low-risk to moderate-risk tiers. If a model falls in the moderate- to high-risk tier, it is tested against the level of exposure relative to a threshold. If the exposure level is high, the regulatory or financial decision-making models are classified as high risk, whereas the same category of models with limited exposure is marked as moderate risk. Models not involved in critical decision-making processes are again tested against the level of exposure and classified as either low risk or moderate risk. This kind of MRT relies solely on judgmental inputs with binary categorical outcomes; there is no room to accommodate more than two answers to any question.
One of the main challenges involved in a decision tree-based risk tree is when multi-level categorical variables are involved, as it makes the decision trees very complex quickly, making them biased and more difficult to represent and interpret. It also fails to adequately differentiate model materiality (the associated risks), resulting in more model assignments in higher tiers (clustering).
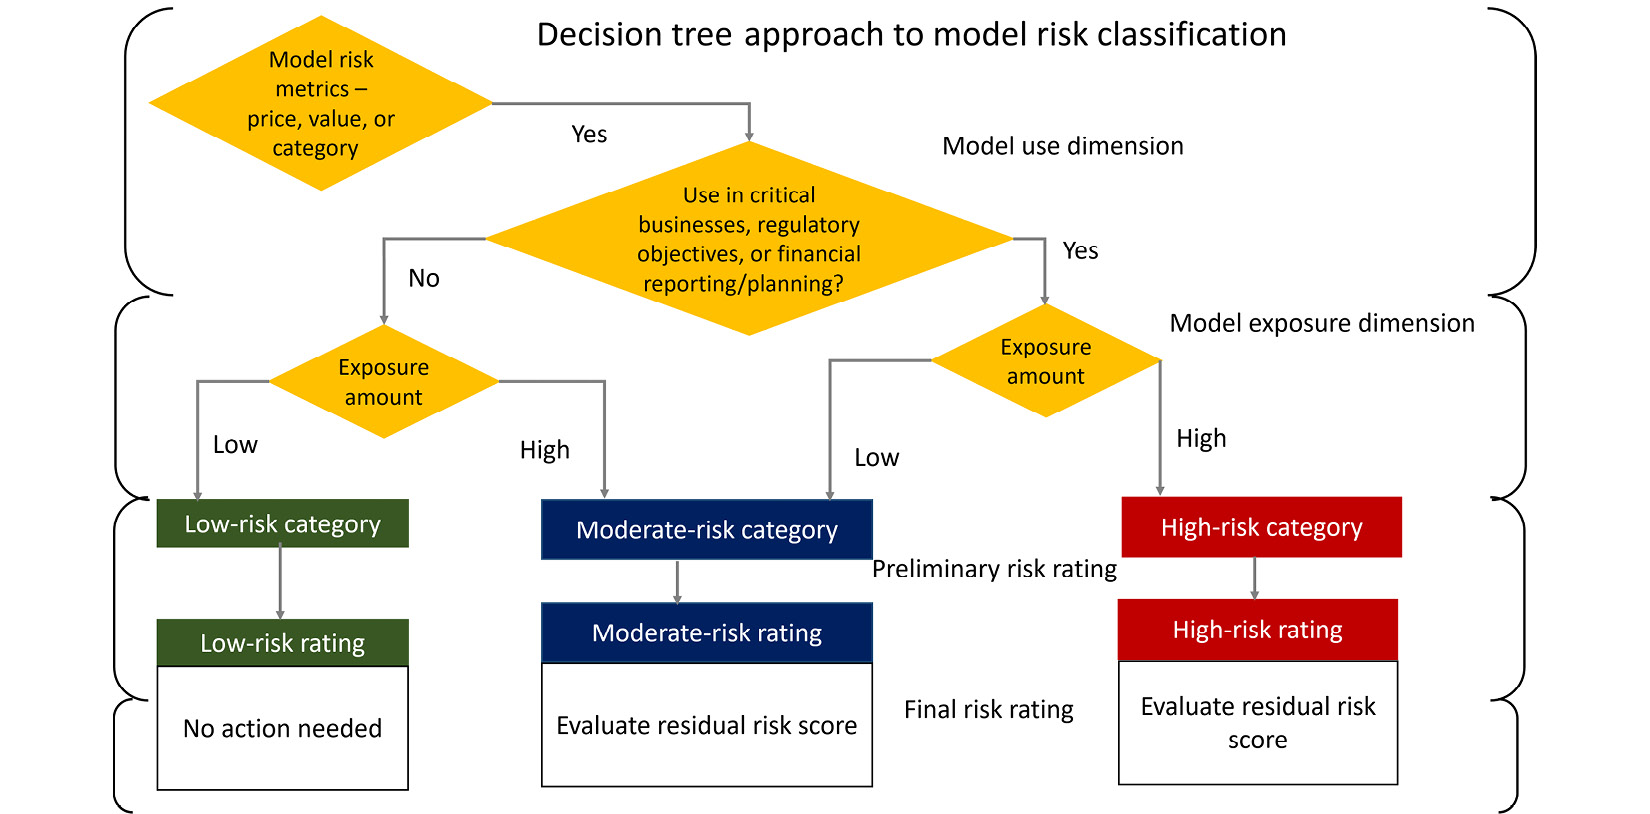
Figure 10.3 – Model risk classification
With visual representations becoming more challenging with multiple variables, the best way to address this is to use a simpler scorecard-based approach, as illustrated in Figure 10.4.
Model risk scorecards
Figure 10.4 demonstrates an example Model Risk Scorecard (MRS) that effectively categorizes the model into different risk classes. This scorecard works on the principle of a factor/element approach, which has four associated factors. The factors can be represented by single elements, as well as multiple elements:
- The Value range column includes the possible range of values that can be served as model inputs. Some of the variables are directly ingested from the model profile, while some other variables are obtained after preprocessing. The data transformation steps help us to transform the variables into continuous, discrete, or multiple levels or categories. These comprise the dollar impact or exposure, the volume of users using the model, and the wide quantity and types of input variables.
- The Weight column denotes the relative importance of each contributing factor (marked in yellow) to the final score. By quantifying it as a percentage, we can represent the significance of each element to the overall scoring structure (in pink).
- There are two adjustments, one of which is a Capital stress testing indicator, which plays an important role in the model classification process. It explains the model’s presence in a specific category irrespective of its score and its influence on other factors.
- MRM adjustment is a score override metric that overrides the base result and allows the addition of the configured value to the base metric. In this example, the flexibility provided to the head of the MRM group has been fixed at 50% of the overall possible value.
- The MRS produces a computed risk score to derive the final risk category to which the model belongs. As demonstrated in the risk tier assignment at the bottom of Figure 10.4, it also contains the current risk rating of the model.
The process of assigning preprocessing threshold boundaries and the importance of certain elements, factor weights, and overall risk score classification thresholds is reflected in the evaluation matrix.
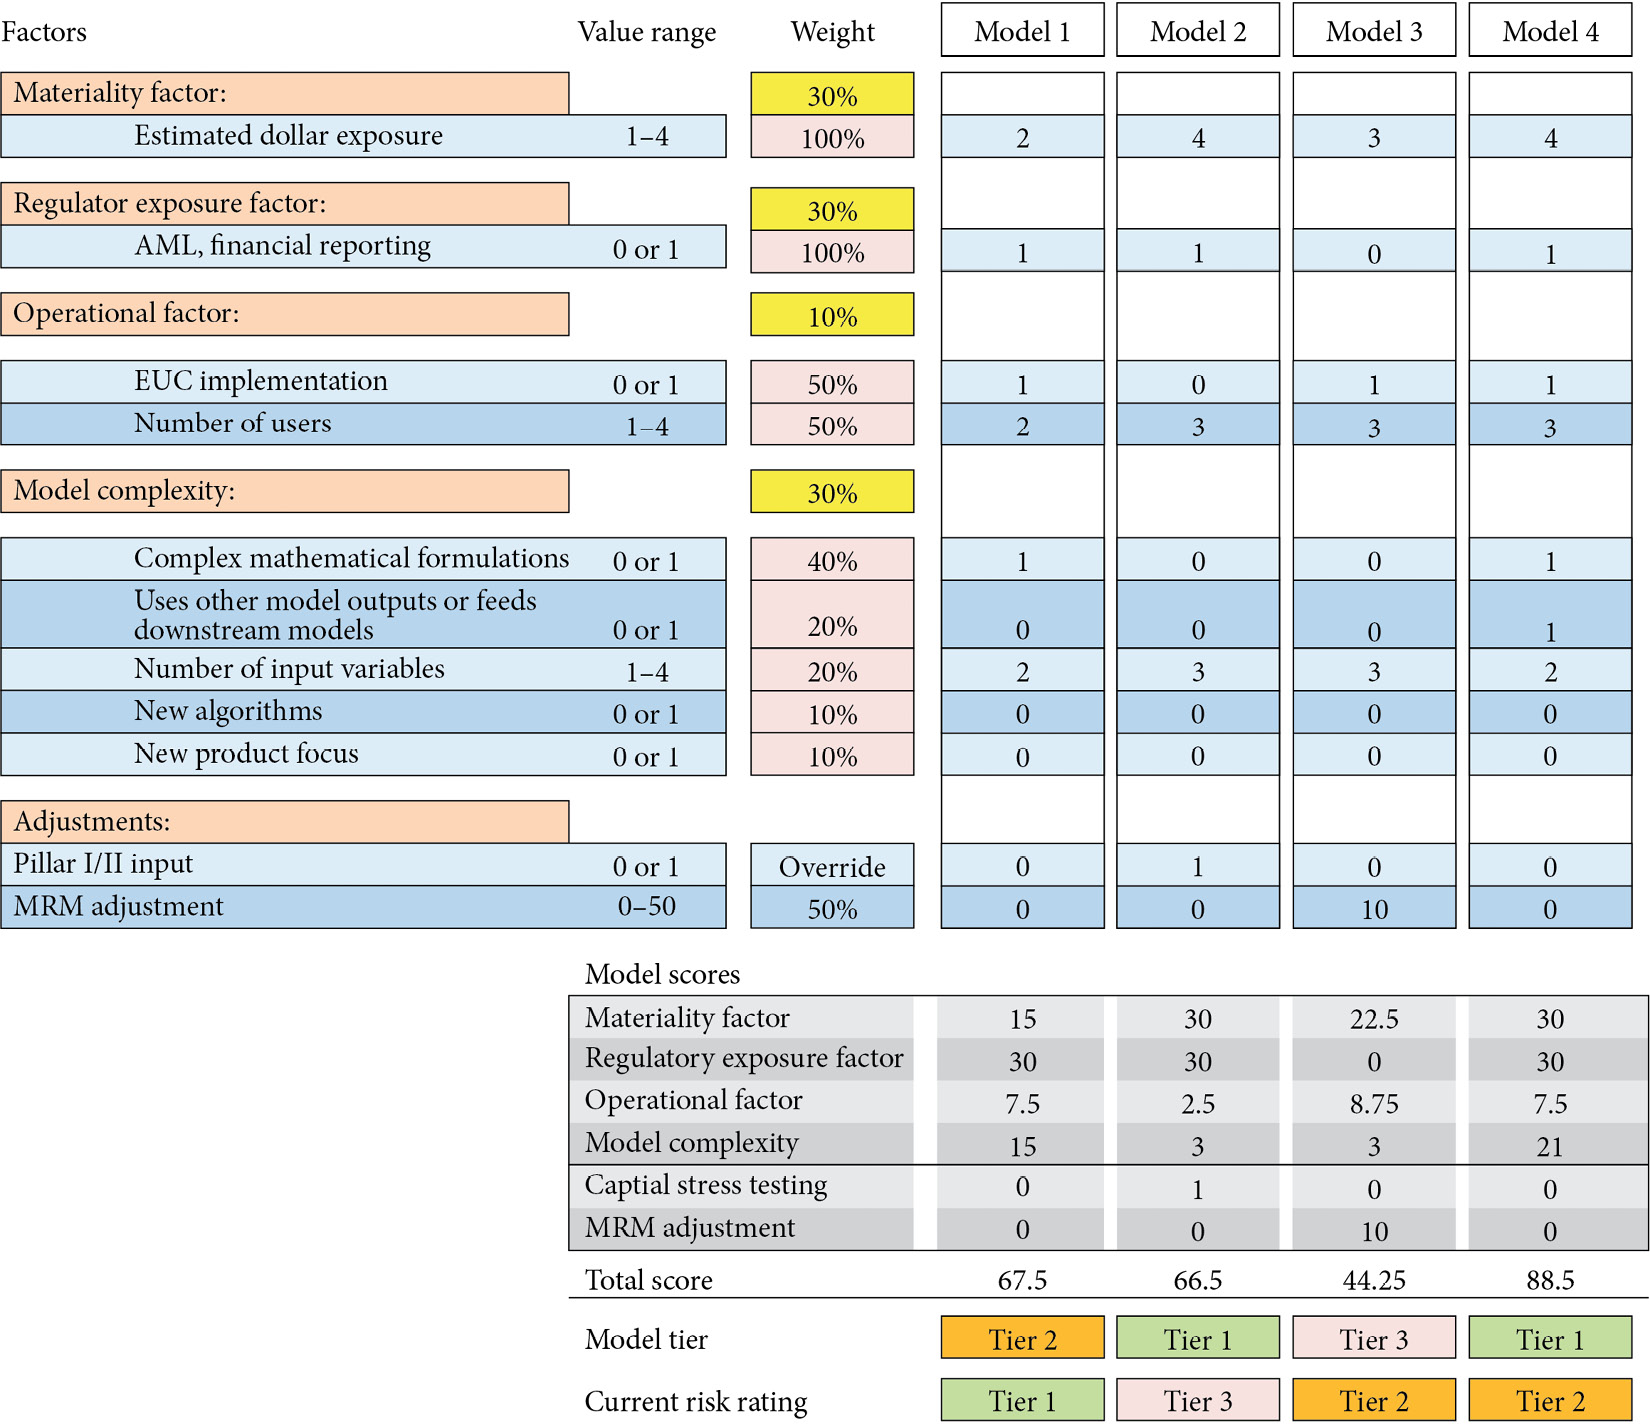
Figure 10.4 – Model scorecard matrix
The sample MRS mixes binary variables with multiple-level categorical variables. It also takes into consideration a weighting scheme, helping to ascertain different parameters of importance. An MRS comes with clear advantages, especially for organizations that wish to include several categorical variables in different categories. The MRS has a lucid representation style that makes it clearer for teams to interpret the plan and consider the impact of using the wrong model.
The Materiality factor score measures the estimated financial impact in currency (in the range of 1 to 4) and the Regulatory exposure factor score incorporates the exposure factor related to AI/ML and financial reporting (scoring 0 or 1). The Operational factor score has an overall contribution of 10% to the model risk tiering process, where 50% is contributed by the End User Computing (EUC) implementation (with a scoring factor of 0 or 1) and 50% of it is contributed by Number of users (in the score range of 1 to 4), which is a multi-tiered categorical variable.
The formula to compute the overall value of this operational risk element to evaluate its contribution to the final score for Model 1 is:
(1 × 50% + 2/4 × 50%) ×10% = 7.5%
We know that the overall score before adjustments is 100, and the operational factor contributes 7.5 points to the overall score for Model 1 (the third row in the model scores for Model 1).
The formula to compute the overall score for this model’s complexity, which influences the risk element in the final score, for Model 1 is:
(1 × 40% + 2/4 × 20%) × 30% = 15%
We can also see that the final model tier is recorded in the highlighted boxes in three different colors (green, pink, and orange). Model 1, with a score of 69, has been classified as Tier 2, whereas Model 2, with a score of 66.5, has been classified as Tier 1, with the threshold being set as 48 points for Tier 2 and 78 points for Tier 1. In addition, the current risk levels for Model 1 and Model 2 have been recorded as Tier 1 and Tier 3, respectively.
We also observe exceptions with respect to Model 2 and Model 3. Model 2’s overall evaluated score of 66.5 points would make its classification fall inside Tier 2, but the model has been assigned to Tier 1. The Capital stress testing override metric is set to 1, which automatically assigns all models used in capital stress testing to the topmost category, which in our case is the highest risk tier. For Model 3, the overall score is 22.5 + 8.75 + 3 = 34.75 points. The MRM team, having risk quantification personnel, has added 10 points to raise the score to 44.75. However, this score is not enough to affect the final model tier assignment, as it is not above the 48-point threshold.
In this example, an operational factor has a definite role to play in explaining the risk of model failure. It considers problems in the restrained environment within which the model gives unexpected outcomes and explores the things that can cause the model to fail due to the production environment.
Model risk calibration
Organizations often end up classifying too many models as high risk, but this does not serve the intended purpose and means the MRS tool needs calibration. One way to calibrate it is to maintain the pre-existing relative ranking of models to minimize the change to model risk assignments. When changes in risk tiers are systematically controlled, this reduces additional work and enables the use of pre-existing risk-related information in the process. Calibration often comes about as a result of exhaustive trial and error, iterative adjustments to model profile elements, and judgmental processes to compare, contrast, and evaluate the distribution of models across different risk categories with that of the inventory.
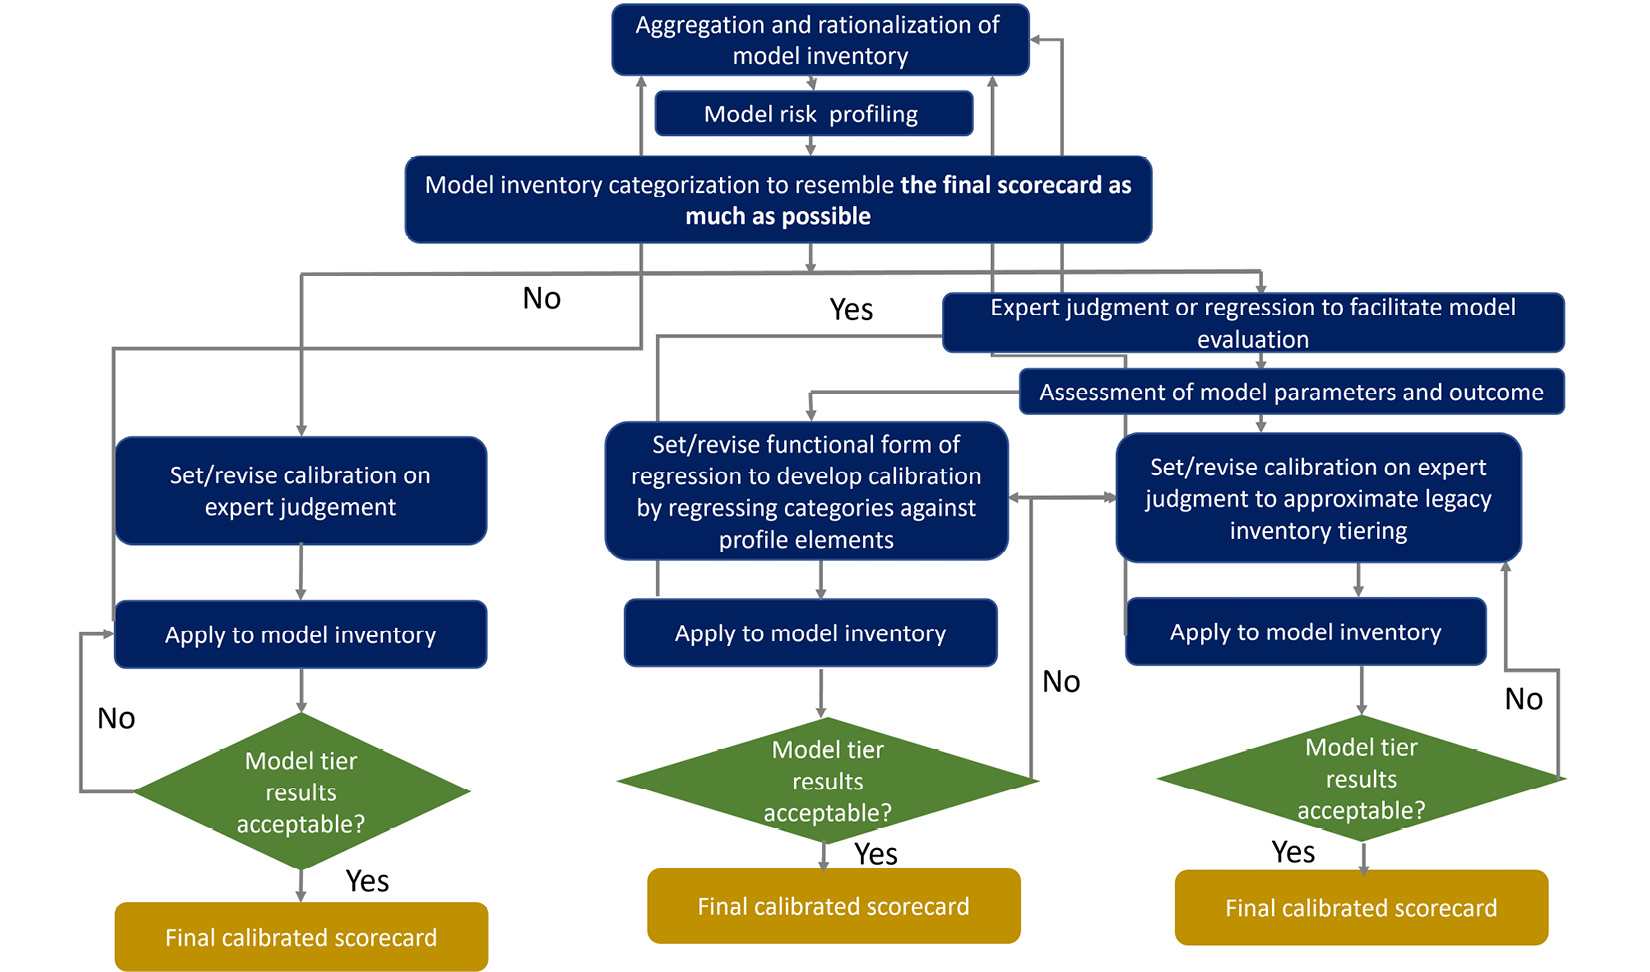
Figure 10.5 – Important factors involved in model risk score calibration
In model recalibration, the changes in model placements across tiers are recorded, and primary factors leading to shifts are also recorded. Some of the factors, as illustrated in Figure 10.5, include the extent to which individual models are reused for a wide variety of products or in varied applications; a comprehensive summary of the model inventory, where missing models are placed in lower-risk tiers; tier-specific MRM requirements that help to align the models; and the proportion of the inventory that should be classified as high risk due to supervisory pressure or being subjected to stress testing. After a review with business and model owners, organizations still may need to set overrides so that the MRS assigns models to tiers as cautiously as possible. This multi-tier classification process aids in interpreting the impact factors associated with models of certain types or with certain uses due to regulatory compliance requirements, financial implications, or other business factors.
In this section, we learned about important concepts related to model risk tiering. Now, let’s learn about a model’s adaptability and resilience, which lay the foundation for a strong MRM framework.
Model version control
Model management is an important element of tracking the ad hoc building of ML models. It facilitates the versioning, storing, and indexing of a growing repository of ML models to aid in the process of sharing, querying, and analysis. When managing models, it becomes increasingly expensive to rerun the modeling workflows, which consume a lot of CPU/GPU processing power. To make model outcomes persistent, it is essential to develop and deploy a tool that can automatically build, track, and own the task of model management in the model development life cycle.
Model management helps to reduce development and tracking efforts by generating insights from each of the ML models with authentic versioning:
- Data scientists get a broad overview of and insights into models built so far.
- It helps us to consolidate and infer important information from the predicted outcomes of versioned models. Examining versioned model metrics allows data scientists to make use of the current model’s impacts on the business.
- It helps us to discover trends and insights into various customer and market segments and speeds up meta-analysis across models.
- The indexing process enables data scientists to quickly search through the model repositories to identify proper or improper use of features.
- It also facilitates easy collaboration between data scientists.
Now, let us discuss how to automatically track ML models in their native environment with a model management tool called ModelDB.
ModelDB
ModelDB paves the way with built-in intelligence to support indexing and model exploration, with SQL queries and a visual interface. ModelDB comes with different native client learning environments (currently spark.ml1 and scikit-learn2), a storage layer optimized to store models, and a web-based visual interface to run meta-analysis across models. It can record multi-stage pipelines involving preprocessing, training, and testing steps by managing information related to metadata (such as the parameters of preprocessing steps and model hyperparameters), quality metrics (such as the AUC and accuracy), and even the training and test data for each model.
As illustrated in Figure 10.6, ModelDB has four principal components: native client libraries for different ML stacks (such as Spark ML, scikit-learn, and R), a backend that defines major abstractions, broker access to the storage layer, and a web UI for the visual exploration of model performance metrics and metadata. The model artifacts (data samples, parameters, attributes, hyperparameters, artifacts, model metrics, and the change versions of all the metadata and parameters involved in training the model) are extracted by the ModelDB client and stored in the backend database through a thrift interface.
The relational database can execute fast search operations to retrieve model artifacts by using model indexes.
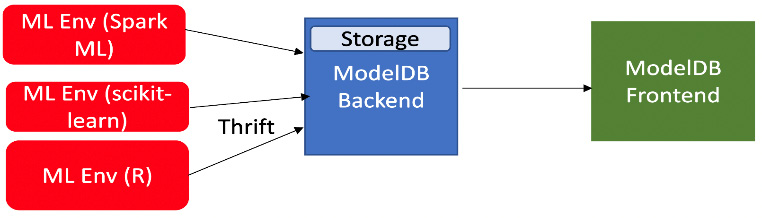
Figure 10.6 – ModelDB architecture
All models and pipelines are stored as a sequence of actions with a branching model that stores the history to record the changes happening in models over time. A relational database at the backend stores pipeline information while a custom engine is employed to store and index models. The frontend is equipped with an easy-to-navigate web-based visual interface that permits visual exploration and the analysis of models and pipelines. Let’s run an experiment using ModelDB:
- To run a ModelDB experiment, we need to have the following imports first:
- Next, we connect to the ModelDB client, set up the first experiment, and initiate our experiment number and dataset version to log all the results related to it. We also load the scikit-learn diabetes dataset for training and testing:
- After loading the dataset, we run
GradientBoostingRegressorfrom the ensemble model library and execute a grid search using cross-validation: - In the next step, we log the best model scores, the loss, and the different hyperparameters used when optimizing the model using grid search results:
- After the training and test metrics have been obtained, we log them in ModelDB. In addition, we also log the best hyperparameters and the actual model file (saved as
joblib): - We can plot the estimators involved versus the training/test scores (for the best parameters returned by the grid result). The plot is logged inside ModelDB as an artifact:
Figure 10.7 illustrates a ModelDB dashboard, identifying a single run ID for a model, along with the dataset version, logged artifacts, observations, metrics, and hyperparameters:
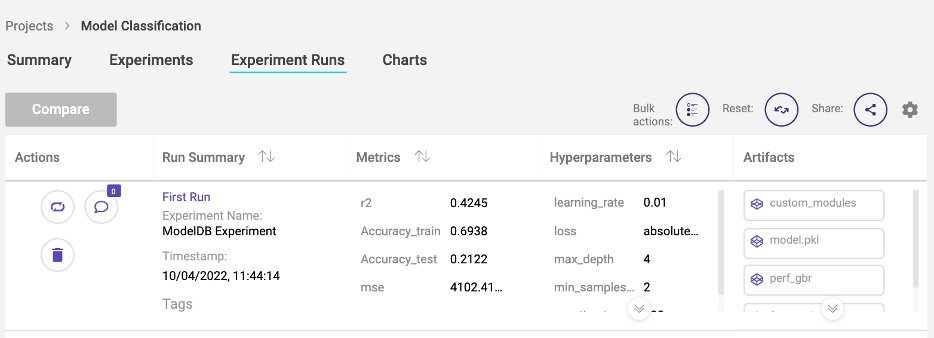
Figure 10.7 – ModelDB experimental run dashboard
The following figure helps us to determine whether we want to study any of the model metrics with an increasing number of epochs:
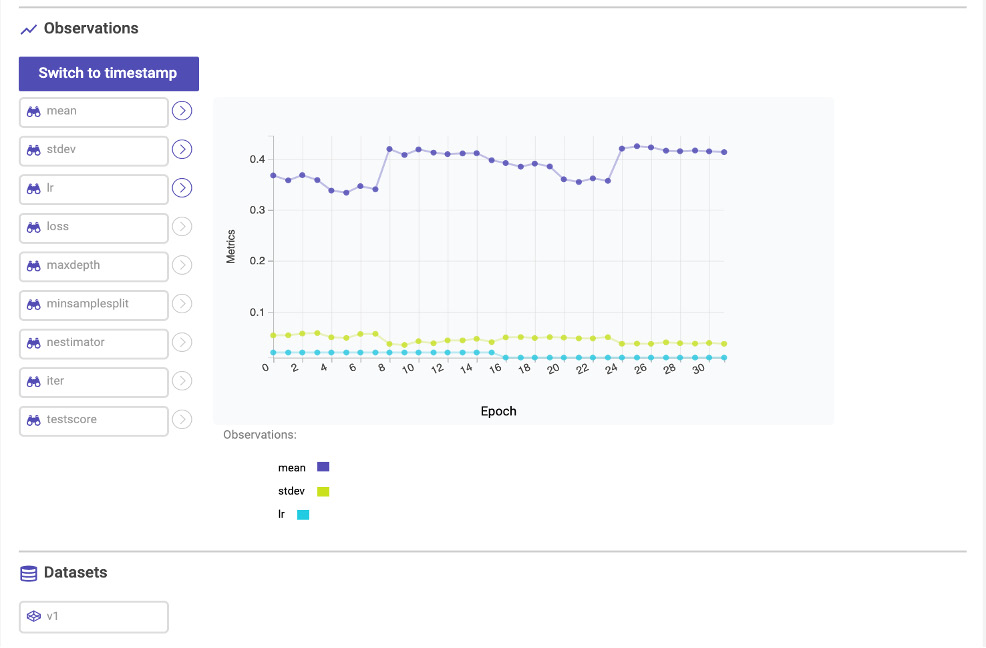
Figure 10.8 – Performance metrics with increasing epochs on a ModelDB dashboard
Having understood ModelDB’s architecture and usage, now let us study Weights & Biases, which is another very popular tool for tracking ML models.
Weights & Biases
Weights & Biases is another experimental tracking tool in MLOps that helps to version both traditional and deep learning models.
Let us see an example to understand how we can track and visualize the results:
- First, we import the library and provide the login key, created using https://wandb.ai/authorize:
- In the next step, we initialize a few experiments by providing random dropout rates to the neural network. The random rates are provided as parameters during the initialization of a
wandbrun: - In the following step, we train our model by defining our loss function and optimizer:
- In the final step, we log the train and validation metrics to
wandband end thewandbrun: - It yields the following summary table, as shown in Figure 10.9, for each number from the MNIST dataset. The table can be obtained using the following code:
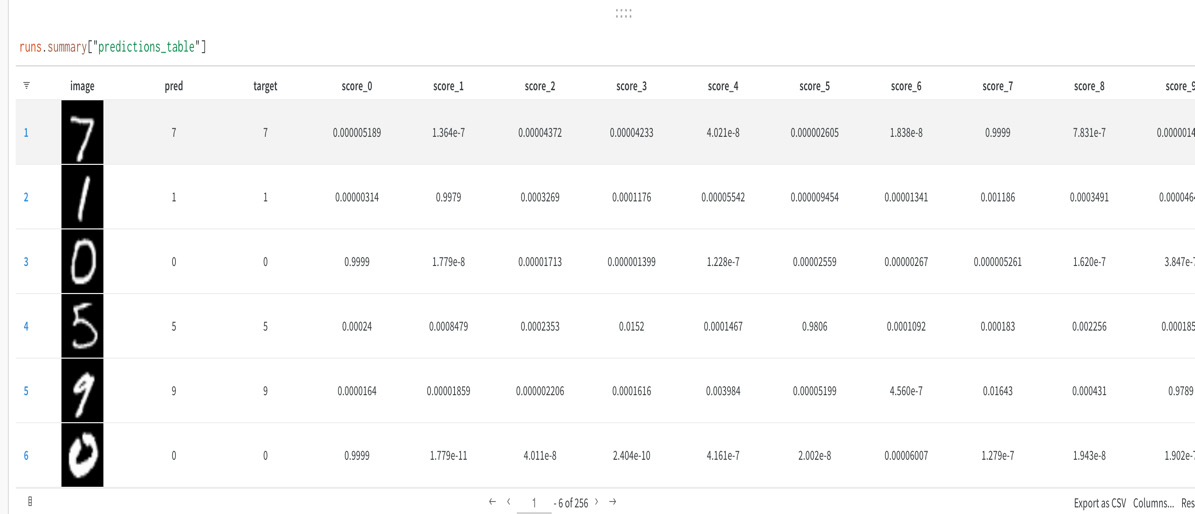
Figure 10.9 – wandb tracking prediction probabilities for digits 1-10
Now that all the model experiments have been logged and tracked with ModelDB, the model lineage can be maintained. For enterprise AI applications, we can also establish cascading lineage information with the help of a lineage tool such as Apache Atlas.
Data lineage with Apache Atlas
Atlas can be integrated with Hive or Cassandra and other databases in which we store predicted model outcomes. Atlas is a scalable framework that meets compliance requirements within Hadoop and seamlessly integrates with enterprise data ecosystems.
Atlas allows us to create new types of metadata with primitive attributes, complex attributes, and object references. Instance types called entities, which capture metadata object details and their relationships, can be created, composed, and retrieved. Atlas offers great flexibility in dynamically creating classifications, such as PII, EXPIRES_ON, DATA_QUALITY, and SENSITIVE, with support for the expiry_date attribute in the EXPIRES_ON classification.
Lineage and search/discovery operations are freely supported by REST APIs using SQL. All the features of Atlas have embedded security, allowing its entities to be associated with multiple classifications without causing data breaches. Figure 10.10 depicts the lineage graph when the output table, ML_O, has been created as the union of two input tables with ML_O as (select * from ML_I2) UNION ALL (select * from ML_I1):
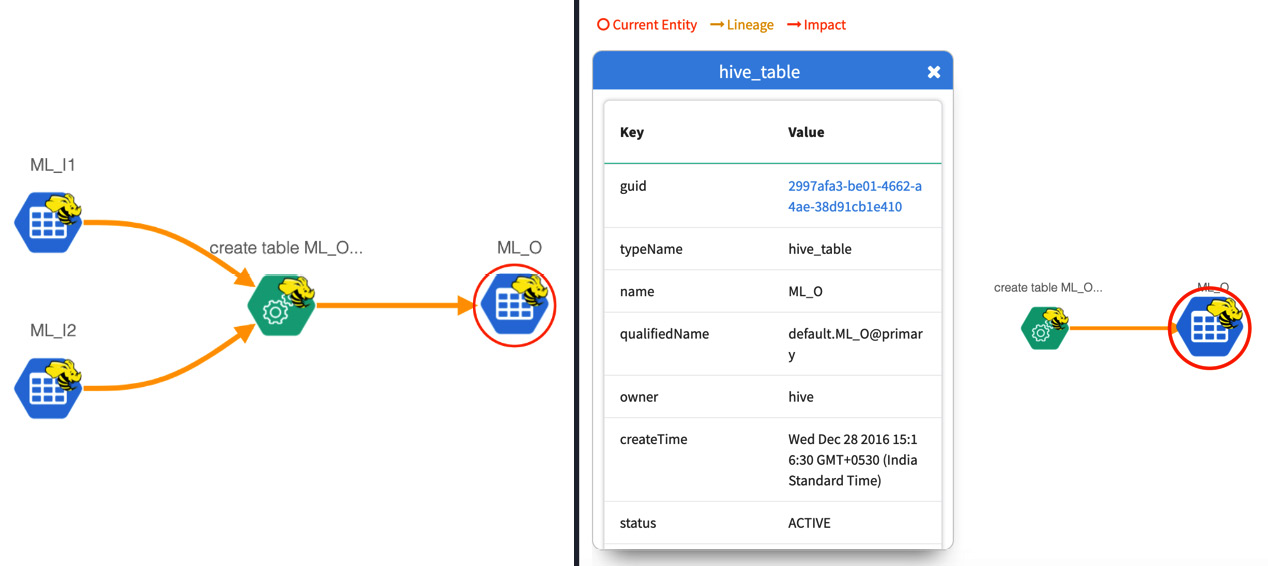
Figure 10.10 – Model lineage with Apache Atlas
Here we are able to see the lineage of an output table, created from two tables, fed into the input. Now let us see how we can execute the same with commands:
- The following
curlcommand illustrates how lineage helps to define a structure in which data sources can be aggregated to create a new aggregated source, inspect a source, or delete a source.
The JSON structure defined within lineage.json creates two input Hive tables, which can then be combined to yield the output table:
- The GUID can be found by clicking on the entity, having discovered all the entities present by calling the API as follows:
- Any of the entities created in the lineage can be deleted using the following:
Having examined some of the frameworks used for model and data governance, let us now take a brief look at what feature stores are and how they can connect the data and model governance pipelines in a reusable manner to foster collaboration when developing production-grade ML models.
Introduction to feature stores
Organizations driven by data, and even legacy organizations, have become aware of the role and importance of feature stores in deriving real-time insights. These insights are valuable for any industry domain, as they convey meaningful information about the customer metrics that drive business. These insights are possible due to rapid development and the use of predictive microservices, which can process data both in batches and in real time. The primary purpose of scalable feature stores in the cloud is to save effort and time by bringing business stakeholders, architects, data scientists, big data professionals, and analytics professionals under one umbrella through one unified foundation block. It facilitates collaboration through the sharing of data, models, features, results, and reports. This unified foundation block, called a feature store, can enhance the model deployment life cycle across teams by allowing the reuse of information to create structured documents, do the required version analysis, and evaluate model performance.
Feature stores primarily aim to do the following:
- Remove the development and maintenance of customized systems by individual teams, and instead encourage a space for coordination with any kind of data across departments.
- Create an access-driven collaborative space for discovering and sharing features for similar types of ML models. This saves time, effort, and the development cost of building new models when data is from the same business and predictions are made for similar customer profiles.
- Reuse data by leveraging existing microservices in scalable big data systems.
- Allow easy integration and communication within microservices with a greater capacity for model feature analysis, retraining, metric comparisons, model governance, and traceability, limiting the time spent on each round of the Agile development life cycle.
- Facilitate the easy tracking, versioning, and retraining of models that exhibit seasonality without the recurring non-linear/exponential costs involved in feature engineering and model training.
- Track the addition and/or removal of features in model training by setting alerts and triggers.
- Derive features and insights based on incoming new data, which can be used to impute features and precompute and automatically backfill features. This includes online computation and offline aggregation so that consistency is enabled between training and serving.
- Ensure the privacy and confidentiality of PII (in databases, caches, or disks) and comply with the design of ethical feature stores by measuring privacy and fairness metrics, along with the interpretability of the predicted model.
Now, let us illustrate a feature store framework as developed by Comcast in Figure 10.11:
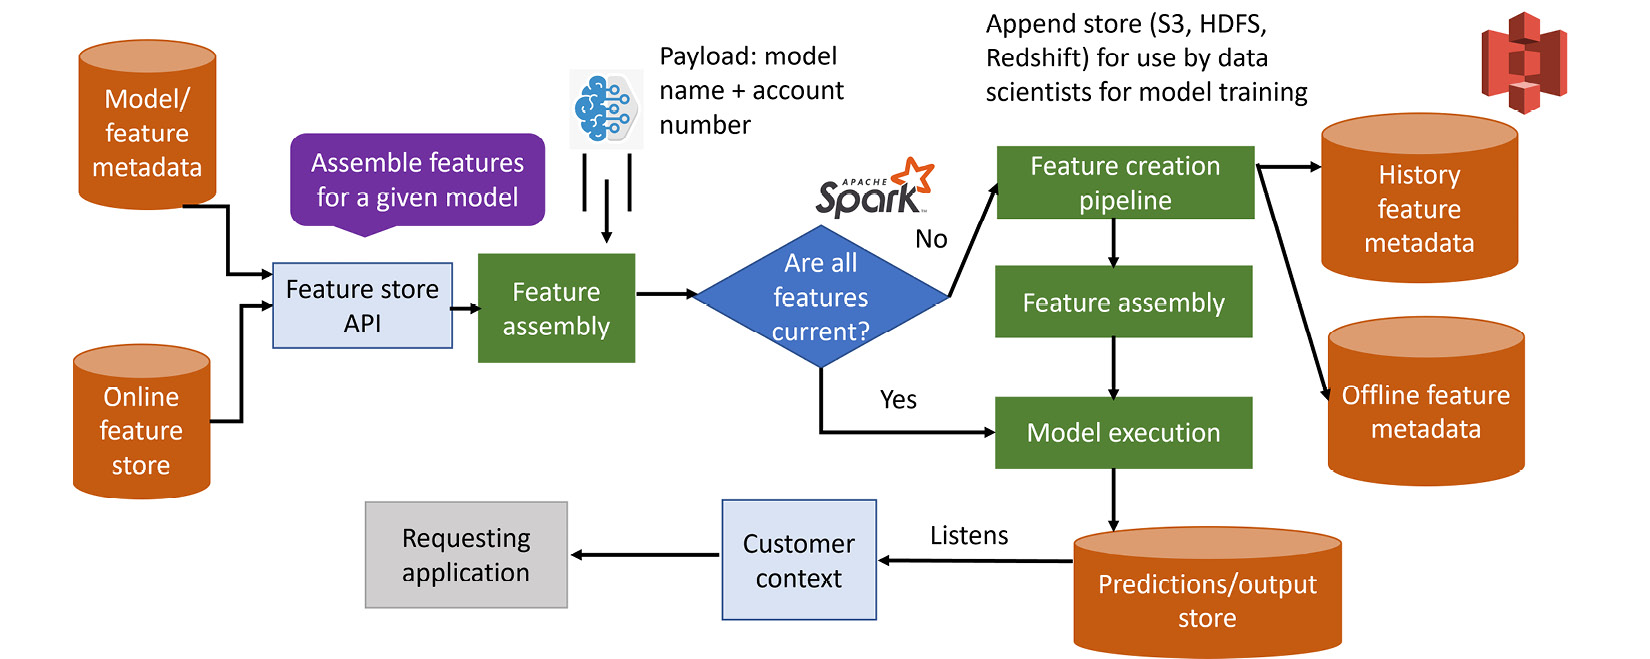
Figure 10.11 – Online and offline feature stores
The feature store architecture shown in Figure 10.11 allows continuous feature aggregation for streaming data and on-demand features. It can help data scientists to reuse versioned features, upload online (real-time)/streaming data, and review feature metrics by models. The feature store is a dynamic, flexible unit that can support multiple pluggable units. The incoming payload to the feature assembly (a repository holding assembled features for model execution containing the model name and account number) is added so that the feature store is continuously refreshed with new data and features, retrained on model metrics, and validated for ethics and compliance. The model’s metadata can explain which features are necessary for which teams and significantly contribute to deriving the model’s insights.
The built-in model repository (as shown in Figure 10.12) contains artifacts relating to data preprocessing (normalization and scaling), displaying the required mapping to the features needed to execute the model. The architecture is built using Spark on Alluxio (an open source data orchestration layer that brings data close to compute for big data and AI/ML workloads in the cloud), S3, an HDFS, an RDBMS, Kafka, and Kinesis.
This kind of feature store can provide scalable, fault-tolerant, distributed capabilities to an organization to share, process, trace, and store use cases, models, features, model-to-feature mappings, versioned models, and datasets. When plugged in with well-defined orchestration services such as Kubeflow, it allows model deployment containers, prediction/outcome sinks, container repositories, and Git to integrate data, code, and runtime artifacts for CI/CD integration.
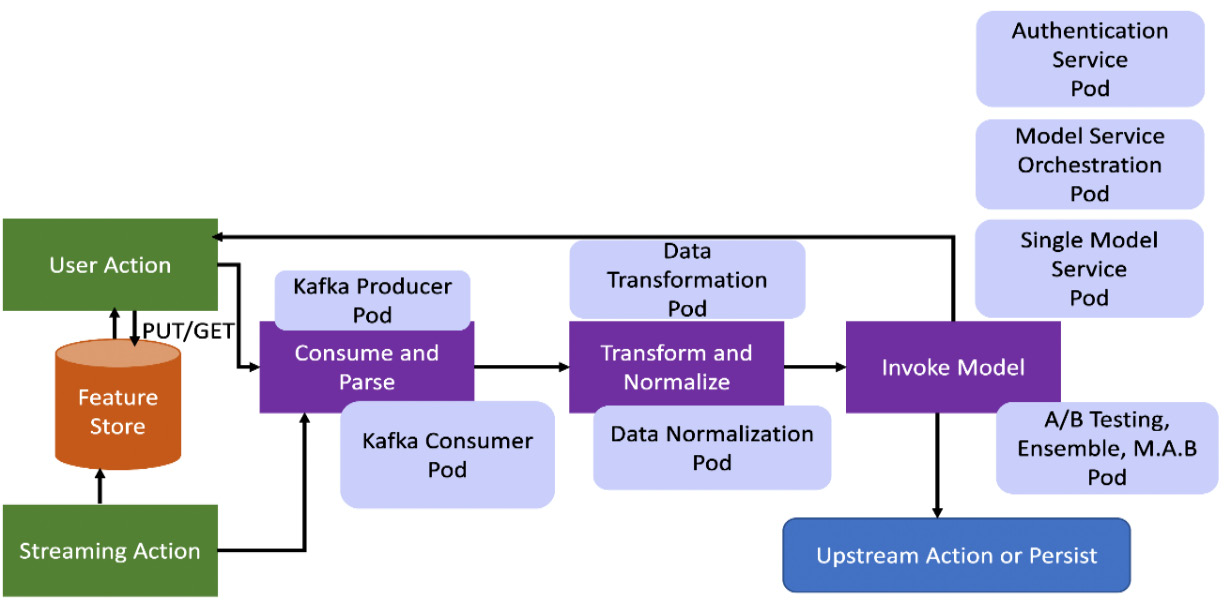
Figure 10.12 – Feature processing in a feature store for online and streaming data
Now, let us see with sample code how to retrieve historical data from a feature store and train a model. Here, we have used Google’s feature store, Feast, and driver ranking data from the BigQuery dataset, feast_driver_ranking_tutorial:
- In the initial step, we have the necessary Python library imports and we load the driver order data from the disk:
- In the next step, we connect to the feature store provider and retrieve training data from BigQuery:
This yields the following output:
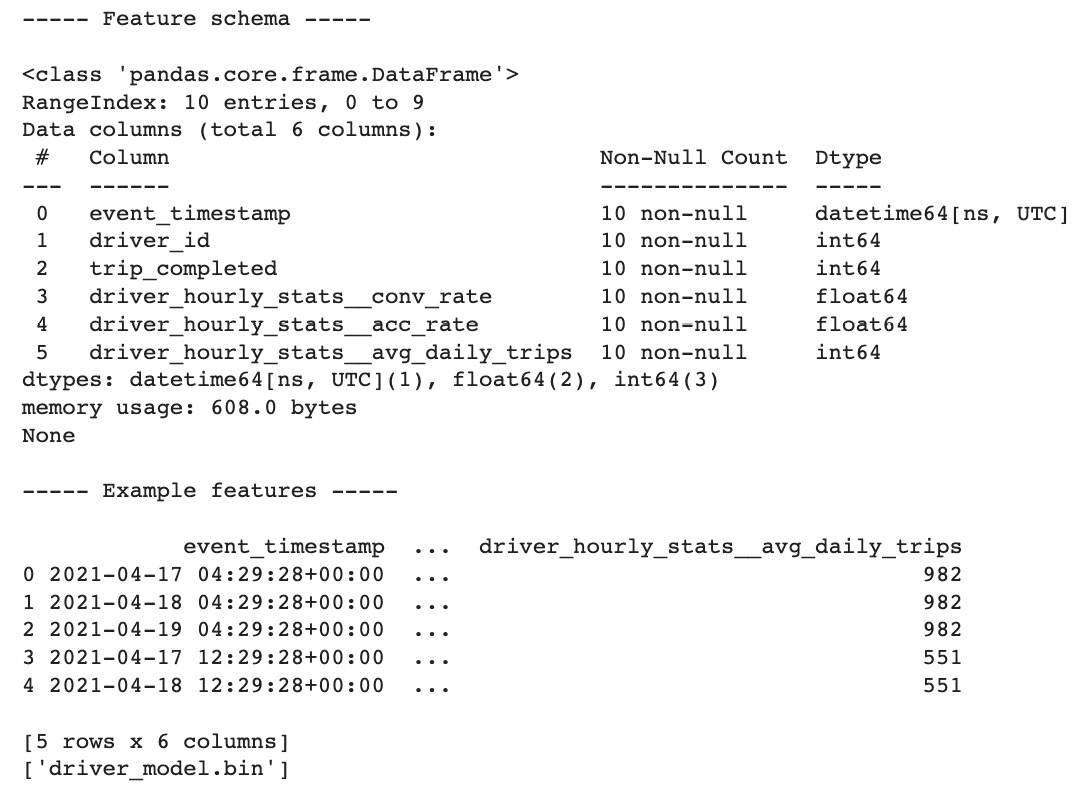
Figure 10.13 – Historical data retrieval with a feature store
- Now, we train and save our model using the following code snippet:
- After training, we need to materialize the online store to Firestore with the help of the following command, where it’s up to the data scientist accessing the feature store to select the date that will be updated in the online store:
This gives the following output:

Figure 10.14 – Saving data to the online feature store
- In the last step, we choose the same feature store again to make a prediction and choose the best driver:
In this example, we have learned how online feature stores may be useful for training and prediction tasks. In Chapter 13, we will learn more about using the advanced concepts of feature stores to encourage collaboration between teams and promote sustainable training.
Summary
In this chapter, we learned about the MRM guidelines and how organizations can use these guidelines to save money. We explored the processes, functionalities, and checklists involved in mitigating business losses by looking at different concepts related to MRM, such as model risk tiering, MRTs, MRSs, and model risk calibration. We also saw how each of the tools is required to ensure the right goals, assumptions, limitations, volume, policy, controls, roles and responsibilities, documentation, measurement procedures, reporting, notifications, risk quantifications, and assessment methodologies are in place. This chapter also provided a deep insight into monitoring model metrics and understanding why it is important as models are subject to drifts and model retraining.
Toward the end of the chapter, we also learned about feature stores. In the next chapter, we will learn about more detailed concepts related to model drift and model calibration.
Further reading
- The evolution of model risk management: https://www.mckinsey.com/business-functions/risk-and-resilience/our-insights/the-evolution-of-model-risk-management
- Model Risk Management: https://www2.deloitte.com/content/dam/Deloitte/fr/Documents/risk/deloitte_model-risk-management_plaquette.pdf
- Model risk tiering: an exploration of industry practices and principles: https://www.risk.net/journal-of-risk-model-validation/6710566/model-risk-tiering-an-exploration-of-industry-practices-and-principles
- Model Governance and Model Risk Management: https://www.afponline.org/ideas-inspiration/topics/articles/Details/model-governance-and-model-risk-management/
- ModelDB: A System for Machine Learning Model Management: https://cs.stanford.edu/~matei/papers/2016/hilda_modeldb.pdf
- Weights & Biases: https://github.com/wandb/wandb