Industry-Wide Use Cases
This chapter presents different use cases of Responsible AI concerning retail, supply chain management, banking and finance, and healthcare. The primary aim of this chapter is to help you develop your skills through practical applications so that you can apply AI solutions to real-world use cases that can help create a more equitable and inclusive world. You will build your knowledge on the usefulness of AI ethics and compliance in a variety of contextual scenarios, enabling you to be more adept at identifying and solving future use cases involving the thoughtful application of AI in different industry verticals. Further, this chapter will allow you to test, measure, and quantify the business outcomes from respective industry domains by applying AI-based tools and algorithms to large-scale distributed systems.
By the end of this chapter, you will be able to create unbiased, fair AI-driven solutions concerning the retail, banking, and healthcare sectors.
In this chapter, these topics will be covered:
- Building ethical AI solutions across industries
- Use cases involving AI applications in retail and supply chain management
- Use cases involving AI applications in banking and finance
- Use cases involving AI applications in healthcare
Technical requirements
This chapter requires that you have Python 3.8 installed, along with the following Python packages using the following commands:
tensorflow-2.7.0pipinstall pycausalimpactpipinstall causalmlpipinstall dice-mlpipinstall causalnexpipinstall auton-survival
While installing these libraries, you may find that the depandant libraries conflict, so it is advised that you install and run the use cases for one library first before moving on to the next.
Let’s begin by looking at how various industry domains suffer from biased solutions and how we can build ethical solutions to improve the customer experience.
Building ethical AI solutions across industries
Chatbots play an important role in the retail, finance, healthcare, travel, hospitality, and consumer sectors, as well as in other verticals. Hence, Responsible AI practices should be able to identify biased chatbots produced by AI/ML models and take proper action to ensure they are fair in their predictions.
Biased chatbots
Chatbots fails to understand a certain accent or dialect, which results in a negative customer experience. The customer is forced to contact your customer service department directly. Chatbots are widely used in the retail industry in the following ways:
- Helping to retain customers by providing 24/7 assistance 365 days a year, providing quick turnaround times, and addressing their problems
- Informing customers about the availability of new products and notifying customers about personalized products that fit the buyer’s interests
- Helping customers to make orders and ensuring a smooth checkout process by taking customer details such as telephone numbers, payment options, and so on
Chatbots trained on data with insufficient diversity give biased answers to end users, forcing them to call customer service directly. Chatbots trained on data featuring the American-English accent might fail to pick up accents and dialects of minorities and underrepresented groups, such as African-American Vernacular English. Examples include the Blender chatbot trained by Facebook on Reddit data. It quickly learned abusive and vulgar language.
A similar case was Microsoft’s AI chatbot, Tay, launched in 2016, which started issuing racist comments and was withdrawn within 24 hours of its launch. Tay was only trained with data from Twitter, demonstrating how predictions from biased datasets can be discriminatory toward different population segments.
Along with chatbots complying with ethical standards, we also need to consider the ethical aspects of Extended Reality (XR)/Augmented Reality (AR)/Virtual Reality (VR) environments as they are used across industry domains. Hence, let’s understand how VR, AR, and XR environments are used in the context of the retail industry and how important it is that they are designed while following best practices.
Ethics in XR/AR/VR
The retail industry has come up with a variety of XR tools comprising AR, VR, and Mixed Reality (MR), where digital features are used to provide customers with the ability to interact with and experience their chosen items before buying them. Retailers are now equipped with AR/VR facilities to digitally project anything that customers may want to try on themselves, from different-sized and colored glasses to jewelry, clothes, shoes, and watches. Customers can also leverage their smartphone cameras to organize their planned furniture purchases in their homes, and even transfer themselves to a different location and enjoy the feeling of the dress or shoes they are wearing.
With the rising presence of brands on social media platforms, both brands and regulatory bodies should be aware of the best practices to promote the ethical use of AI on these platforms. As a result of targeting customers using demographic information and providing personalized shopping experiences, some brands have started to face accusations about their products, as many products have been found to carry racist branding. For example, major international consumer brands plan to remove labels such as “fair,” “white,” and “light” from their products, including the skin-lightening creams that are popular in India.
Kantian duty ethics (which lays down universal moral principles applicable to all human beings, regardless of context or situation) explains that human beings should treat each other with respect and honor in the same way they want themselves to be treated. This is also applicable to the context of AR/VR – if we treat virtual characters with disrespect or commit acts of violence or intolerance, knowingly or unknowingly, we may cause psychological harm to the people that those characters might represent. Thus, designers of AR/VR must scrutinize all possible actions taken by avatars and virtual agents to prohibit them from carrying out immoral actions.
In absence of structured regulations concerning data privacy, copyright, and liability in the field of AR/VR/XR, we can use Kantian duty ethics as a framework for thinking about the ethical implications of AI and the moral rules that should govern the development and use of AI systems. For example, Kant’s categorical imperative, which holds that we should act only in ways that we would be willing to see universalized, could be applied to the development of AI systems. It might be argued that we should only develop AI systems that are aligned with moral values and that we would be willing to see universalized, rather than developing systems that might be used for nefarious purposes or that could lead to negative consequences.
Further, ethical bodies and experienced researchers should evaluate the risk of exposure of vulnerable people to sensitive topics that could cause harm and impact the physical, psychological, and social well-being of users. For example, a customer could visit a fake virtual retail store and be prompted to make fake commercial transactions, where the personal data and bank details of the customer will be stolen.
Hence, developers of such AR/VR systems should consider the following parameters and may need to tune them based on the nature of the audience. For example, certain AR/VR systems could be dangerous for people with disabilities or young or elder sections of the population (https://www.frontiersin.org/articles/10.3389/frvir.2020.00001/full). This includes the following:
- The speed (or framerate) of the AR/VR media and the level of motion sickness people may experience.
- Influencing changes in a person’s sensory, motor, and perceptual abilities, or their manual dexterity or ability to orientate their body.
- The degree of information overload that could affect individuals through acts of persuasion.
- The potential of the long-term and frequent use of XR leading to mistrust of physical world events and over-prioritization of virtual world events, such as customers failing to distinguish between real and virtual events over time.
- The intensification of experiences in a VR environment to which the user needs time to adjust, or consideration of the need for psychological therapy to prevent them from having adverse responses.
- Cognitive, emotional (for example, if a viewer’s avatar is insulted by a fictional virtual character), and behavioral (for example, certain actions accepted in XR are socially unethical, such as gender or racial discrimination, or false attribution toward a specific group) disturbances that people may carry with them after leaving the VR environment and re-entering the physical world.
- Even realistic situations in a virtual world are dangerous in the real world. Such cases arise when customers see something in XR that has no corresponding counterpart in the real world, and they try to replicate it in the real world. An example of this is the chair problem, where customers try to sit on a virtual chair that does not have a physical counterpart.
To design ethical retail industry solutions, we must consider privacy, fairness, and interpretability.
Use cases in retail
Let’s consider some individual use cases that convey the importance of these aspects.
Privacy in the retail industry
Retailers should proactively protect their customers’ sensitive data by complying with legislation governing data privacy and security, such as the European Union’s General Data Protection Regulation (GDPR). There are other legislations that retailers must comply with globally, to protect consumers. This includes the Electronic Commerce Regulations of 2002, Payment Card Industry Data Security Standards, and antispam laws, among the many other rules globally. To safeguard customers’ data, some of the best security practices involve installing firewall services, mandating two-factor authentication, and other security practices detailed in Chapter 2, Emergence of Risk-Averse Methodologies and Frameworks.
Fairness in the retail industry
In the retail industry, it has been observed that AI-driven solutions often lead to disparate outcomes for a wide range of people based on their socio-demographic (gender, race, or other attributes deemed sensitive) backgrounds. Hence, as AI designers, it is of utmost importance that we study the customer segment well to formulate our solutions. We know that in the retail world, the customer profile plays a dominant role in determining the lifetime value of the customer to a company. Consequently, the customer profile, along with their browsing history, leads to decisions where promotions, discounts, and coupons can be granted based on their clickstream sessions (series of events taking place in the user’s browsing sessions). However, even after considering those factors, it has been found that the act of incentivizing a purchase (Koehn et al., 2020, Predicting online shopping behaviour from clickstream data using deep learning, https://www.sciencedirect.com/science/article/abs/pii/S0957417420301676) may lead to a coupon distribution where consumers belonging to a certain social, demographical, or cultural background receive biased and unfair treatment over others, generating negative sentiments for those consumers who did not receive the discounts. An example to illustrate this is when discounts are unevenly distributed and primarily targeted at people from high-income households that have a higher likelihood of making a purchase, excluding people residing in low-income households from discounts.
Furthermore, clickstream sessions have uncovered recognized differences between female and male users, concluding with the fact that even gender acts as a proxy and gives rise to biased models. It has been found from statistical data that female users tend to have higher browsing frequency and spend a greater amount of time per session on a web page. With an increase in browsing time, the backend processing engines of e-commerce platforms always assume that female users demonstrate a greater likelihood of purchasing than their male counterparts. However, this may not be the same for all males and females for all age groups. Even age plays an important factor in yielding different distributions, where the mean age for a female is considerably higher than that for a male. To eliminate the use of unbiased data in our ML models, we need to apply the principle of equalized odds (as studied in Chapter 5, Fair Data Collection), as follows:
- Both male and female users, irrespective of their gender, should have the same probability of being considered eligible for a coupon.
- Both male and female users, irrespective of their gender, should have the same probability of not being considered eligible for a coupon.
This would eliminate the bias that results in privileged users getting digital coupons, even after recording a lower rate of mouse clicks. If we implement the principle of equalized odds, then we can restrict gender biases present in real-world clickstream data, and thus prevent giving an advantage to certain groups via access to more coupons.
Another well-known discriminatory recommendation observed in the world of e-commerce is when AI has been used to personalize website interactions, and where such AI-based systems show remarkably fewer advertisements for new products or products sold by new entrants and small-scale players in the market.
Let’s understand the reasons for discriminatory recommendations here:
- The first reason for a discriminatory model outcome attributed to algorithmic behavior is where the algorithm learns a discriminatory action from actual customer behavior (for example, as more and more people are recommended products of big market players, they are more likely to click those ads).
- The second possible reason is that the algorithm learned the behavior from other data sources (for example, other forms of gender discrimination, such as products and ads sponsored by market leaders based on demographic details of the country).
- The third possibility concludes that it is not a result of learned bias but is rather propelled by the economics of the given region. Examples include ad delivery techniques driving the observed differences (for example, a higher price premium for high-cost ad keywords).
To curb such discriminatory outcomes, eliminate bias, and ensure fairness in AI solutions, as studied in Chapter 5, Fairness in Data Collection, techniques such as the omission of sensitive attributes may not be sufficient alone. This is because other attributes may act as proxies and would result in inherent bias in the predicted outcomes. One such example can be seen in e-commerce, where AI considers a user’s browsing history to predict the most successful advertising content to show. One major drawback of this approach is that information on browsing history is often used as a proxy for gender (for example, github.com as a proxy for men and pinterest.com as a proxy for women). Further, in Chapter 8, Fairness in Model Training and Optimization, we learned about the importance of constraints in algorithmic optimizers that can control bias.
In the world of retail, prices change often and govern sales and revenue, so it is important to justify the causes of price change. So, let’s consider the importance of ethics in pricing items in retail stores.
Ethical price selection
To promote social good, ethical price selection is an important factor when e-commerce apps and platforms employ smart dynamic pricing engines. The design methodology of dynamic pricing engines should address the root cause of price changes to reduce potential harm to customers, the organization, and the wider society. If a business avoids resolving the negative impacts of dynamic pricing, it may result in media coverage, lawsuits, and legislative investigations. Legal and regulatory changes can hurt a brand’s image and reputation and raise customer distrust in the company.
Some of the notable factors in ethical price selection (referenced from https://hbr.org/2021/03/how-ai-can-help-companies-set-prices-more-ethically) are as follows:
- The level of hindrance caused by changes in prices of essential services and products – at worst, blocking access to essential services such as food, shelter, medicine, transportation, and the internet. We observed this during the pandemic when high prices reduced access to personal protective equipment such as N95 masks and hand sanitizer, and people who lost access to them became exposed to the virus.
- In the retail world, before the pandemic, small third-party sellers alleged that big retail players such as Amazon had leveraged their data to compete with these small-scale sellers by buying the same products in large quantities from suppliers at lower costs and selling them at lower prices. High price increases proposed by the AI-powered algorithms of pharma companies have historically blocked access to drugs for chronically ill patients, jeopardizing their lives.
- The degree to which price changes affect vulnerable sectors of the population. For example, when products or services are sold to customers demonstrating chronic/serious medical conditions or on limited incomes, the vulnerability caused by social discrimination becomes more prominent. In addition, in the realm of insurance, guidelines on prospective interest rates that take into account policyholders’ profession, age, and so on have culminated in widespread societal harm, where underprivileged policyholders end up paying higher insurance rates than those in elite professions.
- The ways that pricing engines alter prices cause them to take advantage of customers. This issue often leads us to design interpretable models that provide better-informed decisions on buying. This would also help us to state that customers benefitting from pricing engines are empowered to make better-informed decisions. If price changes always put the business first by taking advantage of customers (such as ride-hailing apps using exponential fare increases in times of need), then such a model needs auditing and approval from regulatory bodies.
Therefore, we can see the negative consequences of dynamic pricing engines in e-commerce, retail, and insurance. As dynamic pricing algorithm experts, we should double-check that the issue gets the required attention from businesses and makes the pricing decisions fair for all customer segments.
Now that we understand the concept of fairness in retail, let’s dig into how the concept of interpretability fits into the retail industry.
Interpretability – the role of counterfactuals (CFs)
Understanding customer pain points and preferences is a key prerequisite for campaigns and promotions on e-commerce platforms. Once customer needs have been identified, retailers can provide promotional offers and discounts and bring back churned customers. For example, for retailers such as Tesco, Carrefour, or Walmart, it is important to be able to identify regular as well as big-fish customers per store, the latter of which contribute significantly toward the overall monthly purchases of that store. Once retailers have understood the primary customer genomes and their preferences, they can not only make real-time recommendations but also drive business decisions through short-term and long-term programs and campaigns.
Customer dissatisfaction can be driven by causal inferencing, which translates intangible variables such as customer satisfaction or customer reward points into key business metrics. One such example of a promotional offer provided to Uber drivers is Uber Pro, which ran as a pilot in eight US cities, to reward the contribution of the most dedicated driver partners. The drivers were rewarded with things such as higher earnings, reduced car maintenance charges, access to faster airport pickups, and free dent repair.
Often, e-commerce platforms make the mistake of giving greater importance to social media advertising as it might lead to, say, increased sales of garments during winter, and when the advertising budget was cut short in other time of the year, the sales were reduced. However, they fail to notice that the months of winter coincide with Christmas, Thanksgiving, New Year, and other festivals where people generally exchange gifts. Hence, social media marketers on e-commerce platforms need to consider the CFs by studying the impact on sales had there been no marketing campaign. This means directly determining the increase in revenue attributable to marketing, as opposed to low prices of items or ongoing festivals that drive people’s purchases. We can carry out a detailed experiment via A/B testing and splitting our customers into two different groups: the control group and the target group. With the control group, we do not perform the marketing activity, while we do with the target group. Then, we compare the uplift in revenue between the target and control groups. Determining the impact of CFs with higher confidence provides insights into the effectiveness of different interventions by measuring the difference between those who are targeted and those who are not. It also helps us evaluate the impact of marketing campaigns, new product launches, promotions, and offers launched in certain regions and targeted at selected consumer segments. We’ll understand the marketing campaigns for CFs in detail next.
Evaluating impacts in marketing campaigns with CFs
With causal inferencing, we can answer causal questions that, in certain cases, cannot be answered through A/B testing alone. We often encounter another difficulty when we have a randomized, controlled A/B test but the treatment (actions taken by individuals) is different for different individuals in the group. Say, for example, someone in the group does not open the email or fails to apply the reward points. We will see an example of how causal inferencing can help resolve this shortly.
First, let’s study how causal inferencing helps us determine the impact of marketing campaigns or promotions on sales by providing us insights into the following:
- How price changes impact a selected campaign metric (positively or negatively)
- How a promotional campaign between selected dates impacts sales
In the following example, we will demonstrate how a retailer can examine the effect of new product recommendations on their websites to conclude whether the impact is positive or negative. We can take any fixed/specific date, such as Christmas. The observed traffic change before and after the specified date will allow us to determine any improvement or degradation achieved through the recommendation framework. The growth or decline of sales can be evaluated using causal impact modeling, showing the effect of an action before and after a specified date. We will demonstrate this in this example. By doing this, it becomes easier to determine and explain whether there’s an increase in the number of organic searches because of the newly designed recommendation framework. In addition, we can also predict what could be expected in the absence of any campaign:
- First, let’s do the necessary imports and load the dataset:
- Now, let’s set the pre- and post-periods for our study:
Next, we want to examine the number of clicks on the retailer’s website during the pre_period and post_period date ranges present in the preceding list:
- Finally, we must analyze the model output by studying the impact of interventions:
Here is the output for it:
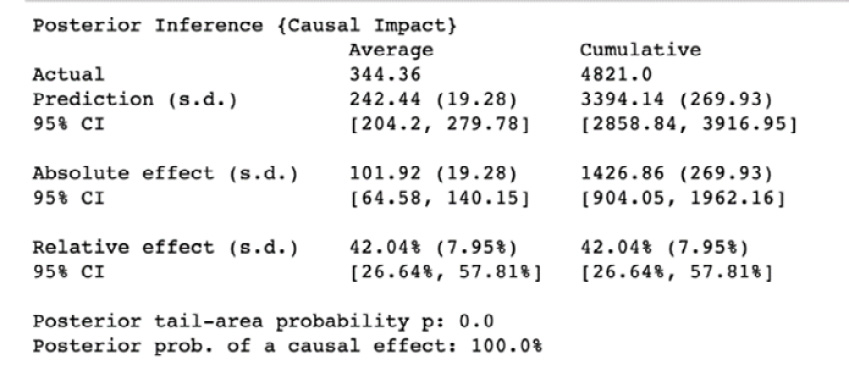
Figure 14.1 – Output obtained from model.summary()
The model summary yields a predicted average of 243 clicks in the post-intervention period among those who did not have any intervention. Through intervention, we determine an association between two variables, X and Y, such that one variable, X, is a direct cause of another variable, Y, when all other variables are held fixed at some value.
However, the actual number of clicks observed was 344. So, the difference between the prediction and the actual number is 101 clicks. These 101 click impressions demonstrate the causal effect of the intervention on the model. The introduction of the product recommendation framework on the e-commerce site, along with other changes, if any, has therefore contributed positively by increasing site traffic by 42%.
- We can also plot the data using
model.plot()to study the difference between the predictions and the actual data:
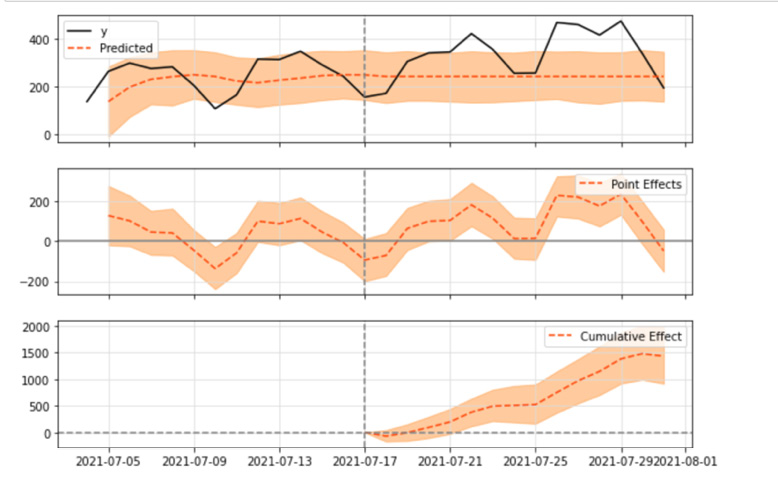
Figure 14.2 – Causal effect obtained through predicted versus the actual number of clicks in the post-intervention period
This is how we study the causal effect before and after the post-intervention period.
We will now study different scenarios that can drive customer conversion through necessary and sufficient causation.
Understanding conversion rates – necessary and sufficient causation
Let’s illustrate the causal effect of a voucher on customer conversion rates by studying three different types of causation:
- Necessary: A mandatory condition without which the customer does not convert, that is, in the absence of a voucher.
- Sufficient: An existing condition, where the voucher helps to convert a customer.
- Necessary and sufficient: The voucher plays a primary role in customer conversion as the customer will not convert in any case without a voucher.
If we need to study these three types of interventions, we can assimilate experimental and observational data to determine the bounds of the probability of each of the preceding types of causation occurring. Once the bounds are available, we can safely infer the most effective way to use voucher-based promotions without wasting money. The following code illustrates the step-by-step method to achieve this:
- First, let’s do the necessary library imports:
Here, we try to observe the outcomes for individuals who choose the promotion (say, people who get a drug or receive a voucher) versus those who don’t. Based on Tian and Pearl’s hypothesis (https://ftp.cs.ucla.edu/pub/stat_ser/R290-A.pdf) on identifying conditions for causal effects, the two datasets shown here can be combined to obtain information that is not visible by looking at either of the datasets independently. This will help us identify the probabilities or the boundaries of necessary and sufficient causation, by combining two data sources, where we have the deaths and survivals in treatment and control groups.
The dataset used for the experiment is shown here:
|
Dataset name |
Group |
Treatment |
Control |
|
Dataset 1 |
Non-conversions |
16 |
14 |
|
Dataset 2 |
Conversions |
894 |
986 |
|
Dataset 3 |
Non-conversions |
28 |
2 |
|
Dataset 4 |
Conversions |
998 |
972 |
Table 14.1 – Experimental simulated datasets
Here is the code:
- Now, for experimental purposes and to analyze the impact, let’s set the label to 1 for 16 treatments and 14 control observations in the experimental dataset, and set the label to 1 for 2 treatments and 28 control observations in the observational dataset:
- Next, we will use the
get_pns_bounds()function to evaluate the relevant probability bounds, which are mainly of three types: - This yields the following probability bounds:

Figure 14.3 – Probability bounds for necessary and sufficient causation
This demonstrates that participants who did not convert and were given the voucher had a higher chance of converting compared to those who did not receive the voucher. Those who got converted and were not provided the voucher would have had a risk of between 0.1% and 1.2% of not converting if they had been given the voucher. Further, we can see that the probability scores range between 0.1% and 0.6% for individuals of being converted, as well as getting the voucher.
Now, let’s understand different types of causal inferencing techniques and how they can be applied to various contexts.
Different modes of causal inferencing techniques
The following figure depicts different ways by which we can carry on causal analysis in a non-mutually exclusive manner, wherein we can apply multiple methods to the same problem:
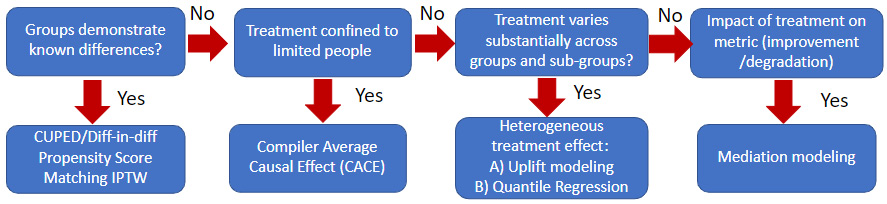
Figure 14.4 – Different causal inferencing methods
The methods described in the preceding figure can be used to eliminate selection bias. Examples of selection bias occur in a rewards campaign when we try to estimate an email’s impact:
- Not everyone in the treatment group who got the reward opened it.
- People who opened the reward in the treatment group are compared with those in the control group that didn’t get a reward.
- People who chose to open the email or apply the reward may be different from those who didn’t choose to open the email or apply the reward.
To avoid selection bias, we could compare the entire treatment (or test) group, irrespective of whether they opened the email or used the rewards program. But this does not prevent the dilution effect where individuals in treatment groups (more suitable in the context of multiple treatment groups) are treated differently. To address and evaluate the impact of actually receiving the treatment, we can use the Compiler Average Causal Effect (CACE), where CACE adjusts the Intention-to-Treat (ITT) effect (that is, the effect of being assigned treatment, which means being subjected to the test conditions under consideration) with the compliance rate. This is because the ITT parameter underestimates the efficacy of an intervention. After all, certain individuals may deviate from their assigned treatment in trials.
This adjustment helps to estimate the treatment effect for the subpopulation that is being treated or being considered for the experimentation. Treatment here refers to the experimental group that experiences the test conditions. The CACE framework relies on the assumption that customers open the email and use the rewards program, and the effect of receiving the actual treatment (customer group receiving the reward program) drives the outcome variable. To summarize, CACE operates through Instrumental Variables (IVs), which determine the causal relationships when controlled experiments are not feasible.
This occurs in randomized experiments, where treatment (in this context, the rewards program) cannot be carried out and, as a result, the impact of such treatment cannot be delivered to every unit. Here, the CACE framework and its IVs can be used. An IV is a kind of third variable that helps us study the effect of a candidate’s cause on an outcome.
When the treatment effect varies across segments
Retail giants and transportation-as-a-service firms (as in the case of Uber) have very varied customer bases to the point that a treatment practiced on one segment of customers does not work on other segments. The Heterogeneous Treatment Estimation (HTE) method of causal inference is recommended to identify customized experiences that can be optimally applied for the benefit of everyone. In this method, the Conditional Average Treatment Effect (CATE) is deployed successfully to compute the treatment effect and operates conditionally on observed covariates. The main objective of this method is to evaluate which subgroup of a given population will benefit the most when subjected to treatment. The evaluation is carried out with the help of A/B testing, where experimental data is used to train the model. The metric represents an upliftment success and is evaluated by computing the largest delta (or difference) between the target (to whom the treatment is applied) and the control group. Uber applies HTE by using its uplift modeling. Quantile regression (which estimates the conditional median of the response variable) is also popular.
Mediation modeling is another well-known method of causal inferencing that is designed to unveil the black box between a treatment and an outcome variable. In other words, it explains why something happened to allow us to conclude whether the findings support a causal hypothesis. This mechanism operates by decomposing the total treatment effect into the following two parts:
- The hypothesis of a particular mechanism representing the average causal mediation effect
- Other mechanisms present that demonstrate the average direct effect
Further, this method brings out the relative importance of multiple underlying mechanisms, where intangible variables have an impact on elements of the business, including revenue and customer satisfaction, and helps formulate both long-term and short-term steps to address customer pain points. For example, when we observe that customers experience the late home delivery of orders by retailers, we often assume that this is due to increased customer engagement, where a customer is frequently changing the ordered items. However, the delay can also be attributed to the presence of a large number of orders, which invariably drive the group toward higher engagement:
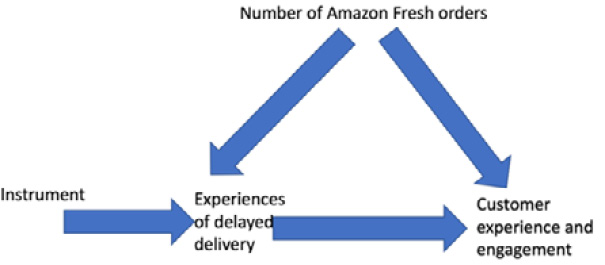
Figure 14.5 – A causal graph with data generation capabilities to demonstrate the influence of an instrument/factor on the candidate’s causal variable
In the preceding figure, we can see a confounding relationship between a factor and the outcome. A user’s number of Amazon Fresh orders represents the existence of a back-door path (a kind of dependency) between the treatment variable and the outcome of interest. Causal inferencing supports observational analysis, where we attempt to block back-door paths. This can be done by limiting the number of orders to, say, three or four. Determining which variables should and should not be controlled involves collaboration between domain experts and data scientists. Additionally, a biased estimation resulting from the back-door path between delayed deliveries and customer engagement can be tackled if we can identify a third variable that impacts the outcome of delayed delivery on customer experience.
Another known approach is the front-door approach, where we try to estimate the effect of a variable by evaluating the relationship between that variable and the outcome of interest. This approach relies on the mediation principle, which requires the introduction of an intervening variable (mostly used in clinical research) other than the treatment (that is, the outcome) and is popularly known as Causal Mediation Analysis (CMA). It plays an important role in dissecting the total effect a treatment has into direct and indirect effects.
The first step in causal modeling is to identify variables that should be included. We apply the causal modeling technique to the identified variables to compare the treated and non-treated individuals possessing the same values for the relevant covariates side by side. The comparison metric relies on the representation of the variables through a predicted probability score. This probability helps us measure the effectiveness of the treatment procedure and is called the propensity score.
The other popular causal inference technique is called the regression discontinuity method. This method helps us study and evaluate the discontinuities present in the regression lines. The absence of continuity at the point where the intervention takes place demonstrates the impact due to an intervention. This has been highly useful in determining how different levels of dynamic pricing influence customers’ decisions to buy an item from a retail store or book a trip on the Uber platform.
Taking Uber as an example, as we study the causal effect, we must be aware that, in its absence, trip request rates should be the same on both sides of a sharp cut-off point, such as the introduction of surge pricing. This holds good under the assumption that riders who are very close to the cut-off point resemble each other with respect to relevant confounding variables (a third variable that influences both the independent and dependent variables). Further, observing any noticeable discontinuity in trip request rates at the point of introduction of surge pricing is an indication that raising prices beyond this point has a causal impact on request rates.
Another similar approach is to analyze the outcome of time series data before and after a candidate causal event. This method, known as interrupted time series design, aims to predict any change in the time series at the instant the event occurred. The most popular methods used for time series analysis for causal inferencing are synthetic control and Bayesian structural time series. One of the popular libraries for Bayesian structural time series analysis is provided by Google in the form of the Causal Impact package.
Now, let’s examine how causal modeling plays a role in solving problems related to the supply chain.
Supply chain use cases
Another important aspect of retail where fairness plays a vital role is in the supply chain. In scenarios where retailers see both shortages and surpluses of stock, it is imperative that, as data science and ML experts, we oversee stock optimization policies. In doing so, we are likely to evaluate fairness allocation based on realized demands and currently available stock capacity. Some of the factors that have a direct impact on fair stock fulfillment (without stock underflow and overflow, by appropriately matching supply and demand) for multiple retailers are as follows:
- Fair inventory allocation by retailers (for example, equal profit, same fill rate, or an equal share of supply while handling demand mismatch). This is governed by a proportional allocation policy (best in times of inventory underflow) or stock scarcity and an equal split of excess inventory (used in times of stock overflow).
- How we can satisfy fairness perceptions in the industry, including elements such as fair pricing and fair wages.
To elaborate further on fairness in the context of integrated supply chain networks that serve multiple retailers, let’s consider a common pool of inventory where the total inventory is allocated at the retailer level, and the total cost is distributed among multiple retailer locations. Stock replenishment and fulfillment orders come to the warehouse, where fairness constraints are incorporated in the following scenarios:
- The total demand from the combined set of retailers exceeds the available supply.
- The total supply from multiple suppliers exceeds the demand.
- Multiple retailers receive stock from the same suppliers.
- A fair inventory split between multiple retailers (subject to other conditions such as the number of items ordered by each retailer) based on market demand to ensure fair profit distribution.
Apart from introducing fairness in stock optimization, from the standpoint of ethics, both accuracy and interpretability become important. This is because optimized stock allocation at different levels of the supply chain cycle can minimize as well as predict shipping delays from the supplier. In addition, we can attribute causes for the delay and suggest remedial actions.
While studying model explainability and interpretability in Chapter 10, we saw that understanding the root cause behind a model’s prediction can help a business take remedial actions. Million-dollar losses from delays in a complex supply chain pipeline can be avoided once the stage and source of vulnerabilities have been identified. For example, as shown in Figure 14.6, a delay in supply chain pipelines occurred during the pandemic, which can be attributed to a variety of causes:
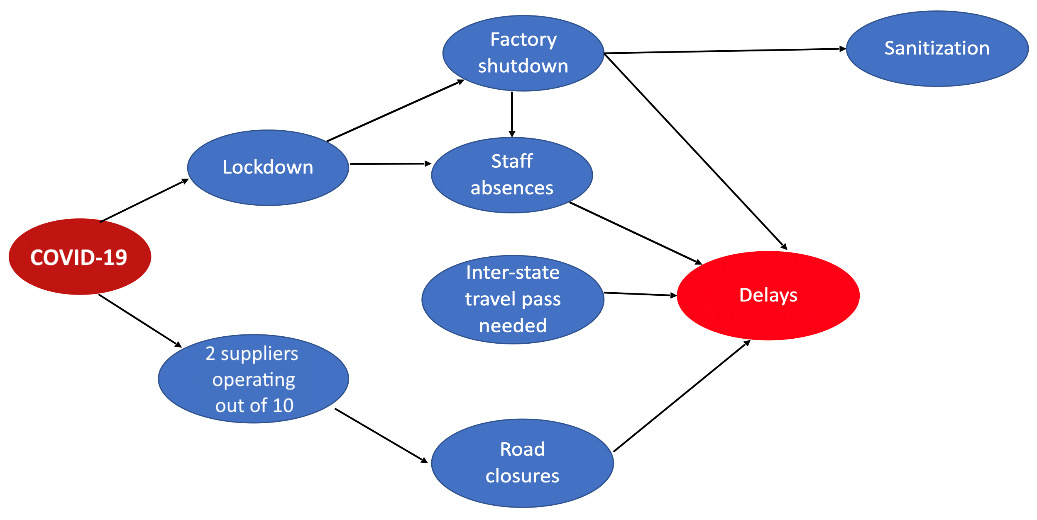
Figure 14.6 – Causal relationships demonstrating direct and spurious correlations
The primary delay factors were lockdowns and a reduced number of suppliers in operation. However, these primary delay factors can lead to other delay factors caused by factory shutdowns, staff absenteeism, or the need for travel passes to transport goods.
To explain the cause and effect, what we need is an evaluation procedure that not only helps in determining correlation but also aids in the causal discovery process through graphs, as we’ve demonstrated here. Once we have a graphical representation of the causal structure, it becomes easier to suggest remedial actions or allocate resources at each step of the problem.
In the next section, we’ll learn how causal structures can help us with supply chain delivery.
Causal discovery for supply chain management
Causal graphs can capture the causal relationships between the different variables in a given problem, highlighting the key players in the system, the role they play in the system, and in what direction. The key system players in a typical supply chain are the following:
- Number of orders and the quantity of each order
- Supply of raw materials at manufacturing plants and the availability of suppliers
- The operational mode of the factory and the number of workers present
- Successful Purchase Order (PO) creation
- An efficient delivery system that confirms delivery data
These principal elements act together in a causal graph, describe their inter-relationships, and state how demand for an item is reaching the destination at an earlier/delayed schedule, along with the impact of the delay on other upstream delivery channels. Hence, any delay and uncertainty of a delivery pipeline can be better explained, which can further speed up the graph discovery process. The relative influence of different variables on an overall delay at two different stages of a supply chain pipeline (PO creation and the order delivery service) is best explained by the following figure:
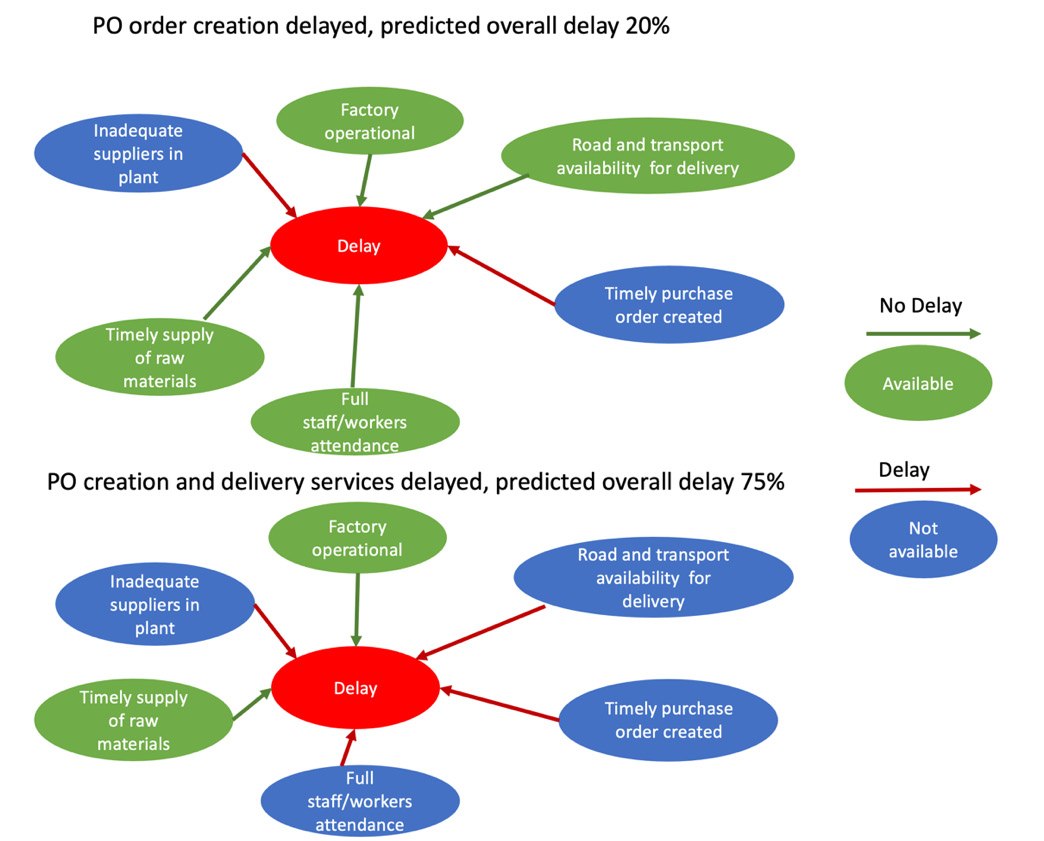
Figure 14.7 – Causal graphs to explain delivery delays at different stages of the supply chain life cycle
We can go one step further and extract a Structural Causal Model (SCM) from the causal graph to explain the interactions of variables, as demonstrated in Figure 14.8:
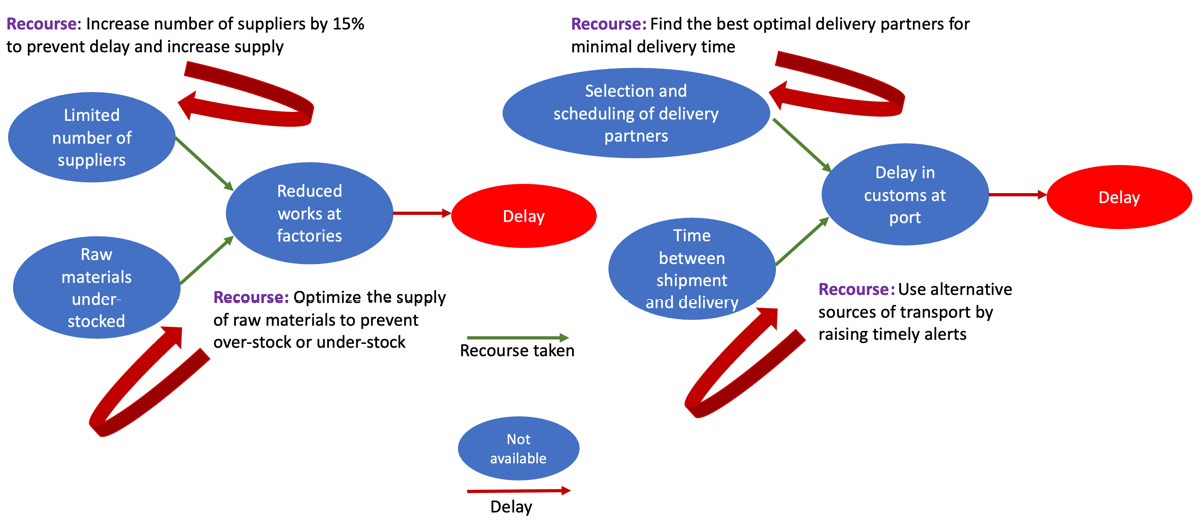
Figure 14.8 – Causal graphs to explain CF recourse for certain orders at different stages of the supply chain life cycle
On the left of the figure, we see that by increasing the number of suppliers by 15% and following an optimal stock fulfillment policy, we can mitigate PO creation delays. On the right-hand side, we see that by using CF explanations, we can discover the best delivery partners and routes, along with alternate sources of transport (for example, using air travel to avoid a delay at a seaport) within the causal graph. Such discoveries are made possible when we have real-time monitoring in the system to trigger CF recourse actions to drive through the best possible routes to reach the destination as quickly as possible.
As well as reducing cost and providing revenue uplift to businesses, these CF recourses, made possible with the help of causal graphs, also allow us to understand the appropriate Key Performance Indicators (KPIs) to be used to reduce cost and boost revenue.
Fairness in multi-stakeholder platforms
Large-scale multi-sided retail platforms such as Amazon, Alibaba, and Airbnb provide personalized recommendations to buyers to connect them to relevant sellers. The recommendation services offered should be designed to promote fairness in terms of the number of items recommended by each seller. This will ensure that items from small-scale sellers also get a fair chance of being recommended to buyers. The principal objective of fair recommendations is to maximize recommendation utility (so that they lead to conversions in the real world) with minimal logistical costs.
A fair policy remains far from being achieved in circumstances where biases creep in and buyers receive low-utility recommendations to satisfy the coverage demands of global sellers. In a fair and ideal system, we can incorporate constraints to satisfy sellers’ coverage criteria alongside buyers’ objectives, yielding high-utility recommendations for each buyer.
Now, let’s walk through how Responsible AI has an important role to play in the Banking, Financial Services, and Insurance (BFSI) industries.
Use cases in BFSI
One important element of ethical AI is interpretability, as we discussed in Chapter 9. Along with model explanations, if we can provide a sort of interaction (to tweak model hyperparameters and features) to model designers, decision-makers, and key stakeholders, then they can tune model hyperparameters and simulate different scenarios for numerical features, allowing them to evaluate and minimize financial loss from high-risk financial models. In the context of BFSI, this would provide a higher level of detail to explanations of high-risk decisions, thereby reducing the risk of critical decisions to life, such as the denial of a mortgage or car loan. Here, CF explanations have a definite role to play where a consistent interpretable explanation could help to interrogate a model to find the required changes that can invert a model’s decision.
The following are some prominent use cases for CFs in BFSI:
- Trading: CFs are used to analyze the potential consequences of different trades and the potential risks and rewards of different investment strategies. For example, an AI system might be used to analyze historical data and identify patterns that might indicate opportunities for profitable trades. CF analysis can then be used to understand what might have happened if different trades had been made, and to optimize trading strategies based on this analysis.
- Portfolio optimization: Optimizing the composition of a financial portfolio by analyzing the potential consequences of different asset allocations. For example, an AI uses historical data to identify patterns that might indicate the relative performance of different assets. CF analysis can then be used to understand what might have happened if different assets had been included in the portfolio, and to optimize the portfolio based on this analysis.
- Risk management: Understanding and mitigating risk in financial systems that involve market risks, credit risks, or operational risks. CF analysis can then be used to understand what might have happened if different risk management strategies had been employed, and to optimize risk management based on this analysis.
Now, let’s see how CF explanation libraries can be used.
The functionality of CF explanation libraries
Having explored a few use cases of CFs in the BFSI sector, let’s see a working example of a CF explanation used in the context of granting a loan application. Our example will use the Diverse Counterfactual Explanations (DiCE) library.
DiCE is a Python library that helps us convey the necessary explanations by presenting feature-perturbed versions of the same input feature that yield a different outcome. In the context of applications such as loan rejections from financial institutions, DiCE is equipped to demonstrate a diverse set of feature perturbations on one loan candidate using a given ML model.
This can boost customers’ confidence by showing that rejection is not the be-all and end-all, giving them directions for how they could increase their chances of getting the loan. For example, if a DiCE CF were to state “had the income been $10K more, then the customer would have received the loan,” it would help decision-makers to evaluate the trustworthiness of the loan application and at the same time guide them with the necessary conditions (such as existing loans or income) that are driving the outcome, such as a loan denial CF explanations over multiple inputs, help them to evaluate fairness criteria, and reduce errors.
However, DiCE comes with two major challenges in generating CF explanations that are diverse and feasible. Hence, an extension of DiCE was created, known as DiCE4EL (short for DiCE for Event Logs – see more at https://icpmconference.org/2021/wp-content/uploads/sites/5/2021/09/DiCE4EL_-Interpreting-Process-Predictions-using-a-Milestone-Aware-Counterfactual-Approach.pdf), which assists with CF explanations for process prediction by capturing and explaining logs (such as those regarding loan applications made to a financial institution) and events at the intermediate stages. DiCE was designed using a generic neural network architecture that predicts the next event by considering both static and dynamic features. We can use this to resolve scenarios where we have long traces of process execution logs that are less understandable. Furthermore, the difficulties encountered in optimizing the CF search with categorical variables are addressed by the introduction of a search for valid CFs in the training set and leveraging that information in the loss function.
Now, let’s see an example of using DiCE to evaluate different feature perturbations of a customer’s application for a loan. The model-agnostic techniques used here apply a black-box classifier. The loss function optimization relies on sampling other points near a given point in terms of proximity (as well as sparsity, diversity, and feasibility):
- First, we must import the necessary libraries for CF analysis and load the adult income dataset:
- After we’ve performed feature transformations with standard scaling and one-hot encoding, we must train the model using
RandomForestClassifier: - Next, we must provide the trained ML model to DiCE’s model object to generate diverse CFs:
This is the output:
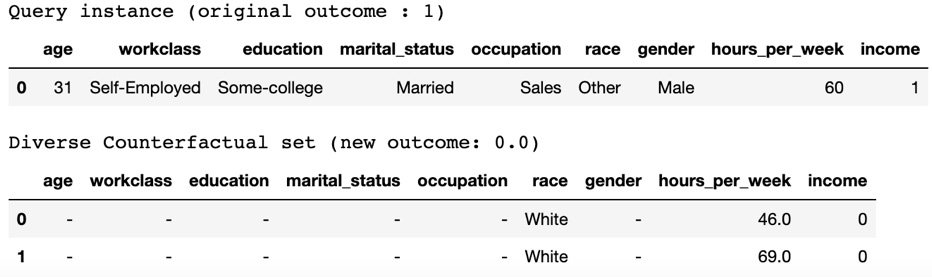
Figure 14.9 – Generated CFs with random sampling
Using random sampling, we can generate less sparse CFs in contrast to DiCE’s current implementation. However, it is also true that increasing total_CFs increases the sparsity of CFs.
- Now, we must select feature ranges to demonstrate how we can precisely control the range of continuous features as an input parameter (
permitted_range) during the process of CF generation. We could use thefeatures_to_varyparameter to set features such as['age','workclass','education','occupation','hours_per_week']:
This is how it appears:
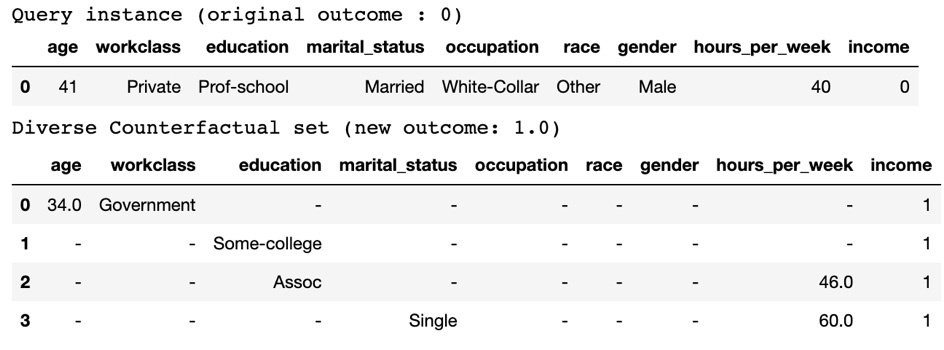
Figure 14.10 – Generated CFs with feature ranges (permitted_range)
To obtain a trade-off between proximity and diversity goals, we try to generate only those CF explanations that are feasible for a user. Here, proximity and diversity help us to understand how close the data is to the original input in contrast to how data that has been significantly modified affects the CF explanations. We also try to set enough diversity for the model to select between multiple possible options. Here, with DiCE, we have set proximity_weight (the default is 0.5) and diversity_weight (the default is 1.0) to tweak the proximity and diversity, respectively. However, we can change them further as we study how the CFs change:
This is how it appears:
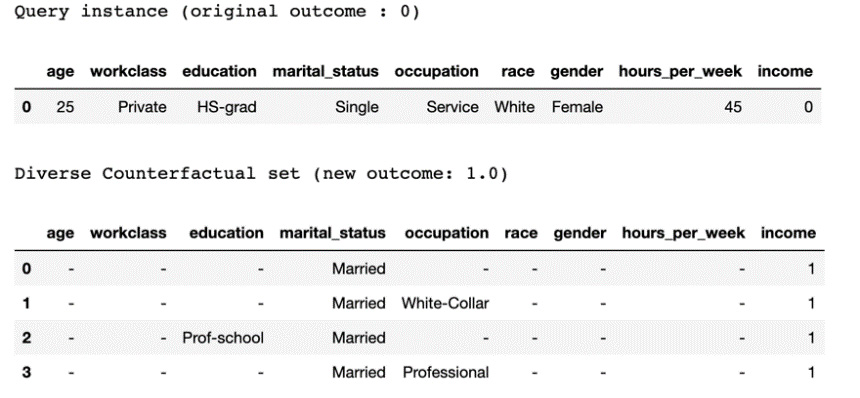
Figure 14.11 – Generated CFs with proximity and diversity parameters
The preceding output shows a diverse set of CFs that were generated from the original data, where the income value gets flipped, education changes from HS-grad to Prof-school, marital_status changes to Married from Single, and occupation changes from Service to either White-Collar or Professional. Such alternatives or diversity help a bank official explain to the individual applying for the loan what could have changed the model’s outcome. In other words, they explain what conditions would have approved the loan instead of it being denied.
In this example, we learned about techniques to generate different types of CFs from the input query by inverting the target income column. We are now familiar with how models provide recommendations for decisions and how we can interact with them. With this foundation, let’s learn how ML models that have been misused can create threats for customers in the BFSI industry. One such powerful threat that we’ll look at next is deepfakes.
Deepfakes
Whether in retail, banking, or finance, one application of AI for which responsible use is required is that of deepfakes. Deepfakes are realistic fake videos, audio recordings, or photos of humans generated using deep learning methods. The generated synthetic videos, audio, and photos of humans are obtained by training models on large volumes of data, where the modeled versions represent modified actions or utterances of words or sentences that the actual person had nothing to do with. As the original actions are modified, there is an unprecedented threat of deepfakes being used to impersonate individuals, resulting in fraudulent phone calls or video conferences. An example of this is using synthetic voice audio of a CEO to instruct staff to transfer assets or funds. Even higher levels of security breaches are possible, where synthetic impersonation of clients via audio or video conferencing could result in the transfer of sensitive information regarding a project or organization.
Now, let’s take a look at the potential threats to the banking and financial sector that result from deepfakes:
- Creation of fraudulent accounts as part of money-laundering schemes. Here, the criminal might fake identities at scale to attack multiple accounts and bring down financial services globally, leading to losses of $3.4 billion globally (https://www.finextra.com/blogposting/23223/why-deepfake-fraud-losses-should-scare-financial-institutions).
- Use of ghost fraud techniques, where criminals leverage the personal data of a deceased person to gain control of their online accounts and services, including credit cards, savings accounts, mortgages, and car loans.
- Synthetic identity fraud, where criminals can assimilate fake, real, and stolen information to create false identities of individuals who do not exist in reality. Synthetic identity fraud is the fastest-growing type of financial crime.
However, despite these abuses of deepfake technology, we also see several advantages in the world of retail, e-commerce, and fashion. The Facebook Shops and Google Shopping platforms use deepfakes to reach out to small- and medium-sized retailers to promote their sales through e-commerce platforms. For example, Cadbury used AI based ML models to recreate a popular actor’s face and voice, bearing very close resemblance to the actor’s voice, uttering the local store or brand’s name. Retailers are exploring realistic digital models and the power of Generative Adversarial Networks (GANs) to create a better experience for customers. Deepfake models demonstrate outfits with different skin tones, heights, and weights, appealing to a wider range of customers. Small and medium-sized retailers are thus able to save costs and fully leverage the capabilities of immersive photorealistic platforms (such as Unreal Engine) to generate live models and backgrounds.
In the interests of security and privacy, organizations need to keep the following guidelines in mind to prevent the threats that arise from deepfakes:
- Enterprise security teams should employ efficient cybersecurity strategies using cybersecurity and social media monitoring tools to monitor payments and transfers.
- Organizations should educate employees on deepfake technologies. All staff in the organization should be knowledgeable of how to detect deepfakes, such as inconsistencies or the unnatural movements of the people in them.
- Apply biometric and online face verification techniques to verify and authenticate existing and new users.
Now that you understand the role of AI in BFSI, let’s look at different use cases in the healthcare industry.
Use cases in healthcare
As we delve into the ethical use of AI in the healthcare industry, we should know how the early detection and treatment of diseases relate to ethical AI. Here are a few examples:
- AI can support diagnosis using X-rays, CT scans, and MRI imaging techniques.
- Detecting cancers, tumors, and other malignant cells in the early stages of development.
- Experimenting with and determining whether a treatment is working.
- Monitoring patients to identify the reoccurrence or remission of a disease.
The following figure illustrates how AI-based deep learning algorithms can help identify the presence of an IDH1 gene mutation in a brain tumor after being trained on images that radiologists and doctors have labeled as suspected cancer (https://www.cancer.gov/news-events/cancer-currents-blog/2022/artificial-intelligence-cancer-imaging):
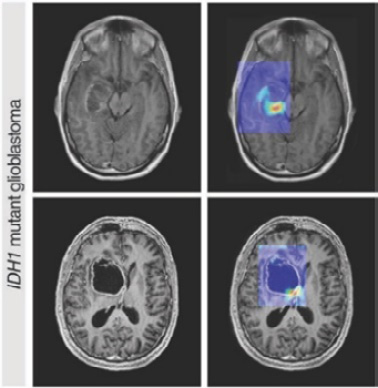
Figure 14.12 – MRI scans predicting the presence of an IDH1 gene mutation in brain tumors
When predicting the presence of high-risk diseases, we should design systems that are compliant with healthcare standards. Let’s study a reference architecture using Google Cloud, which is compliant with these standards.
Healthcare system architecture using Google Cloud
Now, let’s study the different cloud components needed to design a compliant, large-scale, distributed healthcare system for storing medical data and disease diagnoses:
- DICOM imaging data obtained from radiological tests can be ingested via the Cloud Healthcare DICOM API for easy search and retrieval. This API also provides metadata extraction and data assimilation (stored in BigQuery) functionalities to infer advanced insights into disease prediction and clinical investigations.
- Compliance with industry-wide healthcare standards:
- FHIR: An emerging healthcare data interchange standard
- HL7v2: The most popular method for healthcare systems integration
- DICOM: The dominant standard for the radiology and imaging domain
Further, it also supports data format conversion using the Cloud Healthcare API and Cloud Dataflow from HL7v2 to FHIR format. In addition, it offers compliance with HIPAA in the US, the PIPEDA in Canada, and other global privacy standards.
- A unit equipped to detect the arrival of new data and send notifications via Cloud Pub/Sub to applications. This allows seamless integration with the HL7v2 message-parsing stack.
- A data de-identification (via redaction or transformation) service to protect sensitive data elements that can be used for analysis, ML models, and other use cases.
- Integration with Cloud Datalab and Cloud ML to explore large-scale datasets and train on DICOM radiological and natural-light images stored in Cloud Healthcare API datasets:
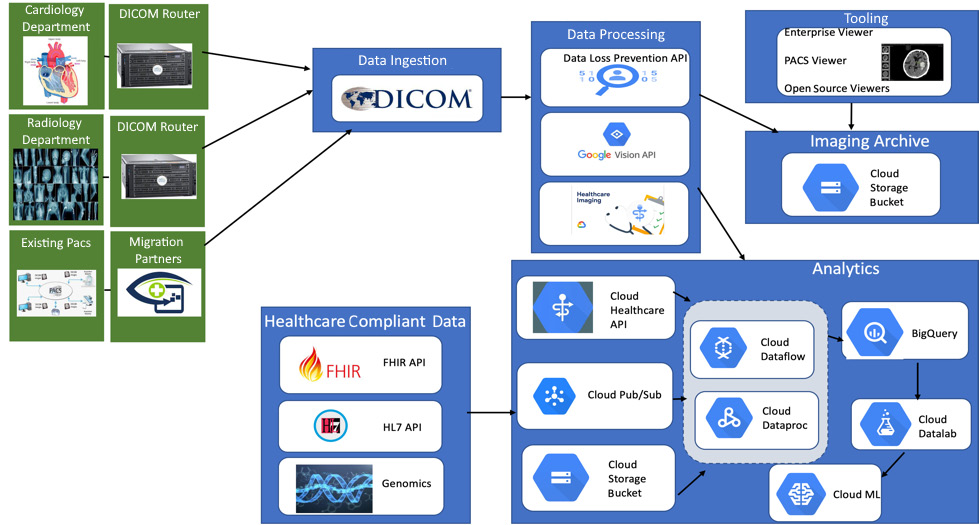
Figure 14.13 – Healthcare system architecture using Google Cloud
Now, let’s learn how to build Responsible AI systems before a disease goes into remission, before a patient or group of patients progresses toward death (for example, during COVID-19), or to evaluate different treatments within a clinical trial. In such cases, we need to develop AI models using survival analysis.
Survival analysis for Responsible AI healthcare applications
Responsible AI applications in the field of healthcare require accurate predictions on the occurrence or likelihood of adverse events such as disease, hospitalization, and mortality. To solve such problems, we often use survival analysis, a statistical measure that can predict the time to failure and time to occurrence of events. In addition, survival analysis is capable of handling censoring (a kind of missing data problem) when expected events do not happen during the study, either because subjects of interest have not participated in the study or have left the study before the study ended. In such situations, a researcher might have partial information available on the survival times for the patients during the pandemic – for example, where patients were found to die due to diseases other than the virus. An example of this is when researchers wanted to study the average time it took for patients to start showing signs of infection of the virus but were missing data of individuals on account of not having proper data collection processes in place to authentically collect data over the period when a virus infects a patient’s body.
The following are the key capabilities that we need to have to build a responsible survival analysis model:
- Survival regression with adjustments in scenarios of domain shift
- Analysis of censored data and study of the impacts of different censoring theories
- CF and treatment impact estimation and evaluation
- Subgroup discovery and phenotyping to identify and stratify risk factors to different groups
- The presence of multiple time-dependent and time-varying covariate observations per individual to help uncover temporal dependencies while estimating time-to-event predictions
- Virtual twins survival regression (virtual twins enable visualization, modeling, and simulation of the entire environment with an enhanced experience) to understand individual behavior and responses to heterogeneous treatment effects of an intervention
Now, let’s look at an example that uses the Cox proportional-hazards deep neural network with the open source auton-survival package. This package helps evaluate the interactions in the model (through the proportional-hazard ratios) between a patient’s covariates and the treatment’s effectiveness and serves as a mechanism for suggesting personalized treatment recommendations. Let’s get started:
- Let’s begin with the required library imports. Note that for this example, we are using the
SUPPORTdataset, which comes with theauton-survivalpackage: - Next, we will create the
SurvivalModelobject and use thefitfunction to train the model. Thetimesvariable we’ve set here is used to tune the model hyperparameters over a certain period. We have also provided the code for training, along with the output for a selected parameter, from theparam_gridparameter defined here: - We must also compute the survival probabilities for the validation set, along with the Integrated Brier Score (IBS):
- Following this, we must obtain the survival probabilities on the test set. Further, we must also get the predicted outcome of a particular model over a selected hyperparameter. The
timesvariable helps us fetch the model hyperparameters used at a certain time: - Finally, we must evaluate the IBS and time-dependent concordance index for the test set. This determines the model’s performance:
The final model performance statistics over the set of model hyperparameters are shown in the following plots:
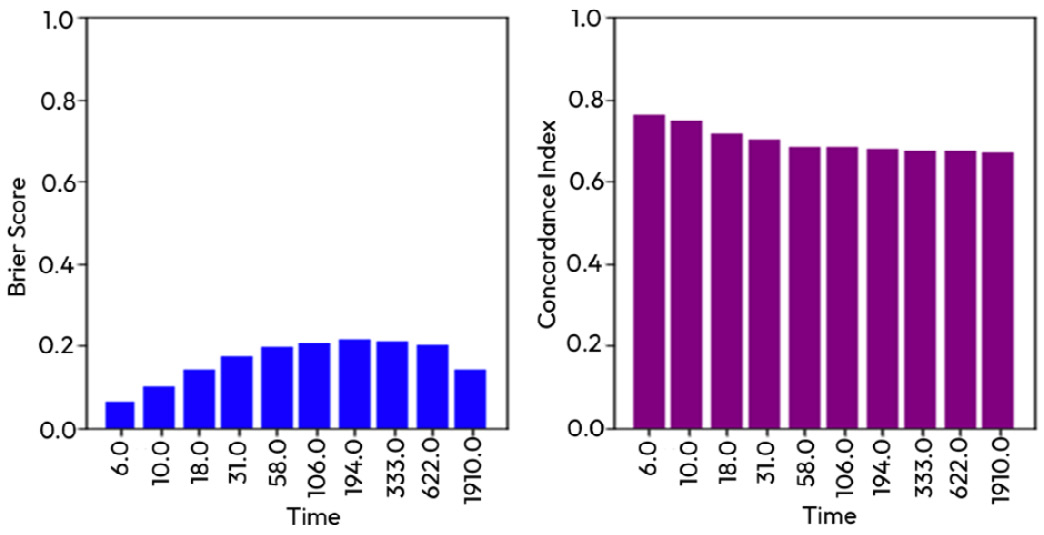
Figure 14.14 – Model performance overtuning with hyperparameters
In the preceding example, we learned how to use DeepSurv (a feed-forward deep neural network parameterized by the weights of the network) to evaluate an individual’s risk of failure (non-reactive to treatment, sometimes leading to death) by leveraging the impacts a patient’s covariates had on their hazard rate. In the healthcare industry, this serves in offering personalized treatment plans/recommendations by allowing us to study how effectively an individual reacted to the evaluated hazard rate based on the hazard-specific treatment. Furthermore, we can also undertake A/B testing by creating a target group (which receives the treatment recommendations) and a control group (which does not). We can run a log-rank test on the two groups’ outcomes to validate whether the difference between the two subsets is significant, representing how effective the treatment recommendation was.
Now that we understand the role survival analysis models have in terms of Responsible AI, let’s summarize what we have learned in this chapter.
Summary
In this chapter, we examined a variety of AI use cases concerning the retail, supply chain, BFSI, and healthcare sectors. We saw the regulations and standards that retailers must follow to comply with privacy laws, and we understood, as advocates of Responsible AI, both the positive and negative consequences of dynamic pricing and how fair pricing can be achieved. Next, we delved into understanding CFs and their indispensable applications in the retail, supply chain, BFSI, and healthcare industries. Via examples, we learned how CFs help us in evaluating marketing campaigns, calculating conversion rates in the retail industry, understanding the impacts of delays, and mitigating them in supply chain pipelines. We also worked on a practical use case to dig into a loan application process and generate diverse CFs to see how they would impact the approval/rejection of a loan application.
We also understood the necessity of audits and Responsible AI regulations to regulate deepfakes, chatbots, and AR/VR/XR media. These innovations can endanger people’s lives through discriminatory and unethical misuse. Next, we studied how to build a scalable, compliant, and distributed healthcare system architecture. Finally, we gained insight into survival regression modeling and how it can help us evaluate and suggest effective patient treatment methodologies.
With this, we have covered the concepts surrounding platform and model design. We hope you are encouraged to further the knowledge you’ve acquired from this book and keep learning!
We hope you have enjoyed reading the book. With ChatGPT coming up and although Responsible AI being a significant aspect of it at this moment, we could not cover AI ethics related to the design of Large Language Models (LLMs), Metaverse, and Blockchain. Hopefully, we can in the future versions.
Further reading
To learn more about the topics that were covered in this chapter, take a look at the following resources:
- The Cost of Fairness in AI: Evidence from E-Commerce – Moritz von Zahn, Stefan Feuerriegel, and Niklas Kuehl: https://aisel.aisnet.org/cgi/viewcontent.cgi?article=1681&context=bise
- Using Causal Inference to Improve the Uber User Experience: https://www.uber.com/blog/causal-inference-at-uber/
- How AI Can Help Companies Set Prices More Ethically: https://hbr.org/2021/03/how-ai-can-help-companies-set-prices-more-ethically
- Supply Chain Root Cause Analysis with Causal AI: https://medium.com/causalens/supply-chain-root-cause-analysis-with-causal-ai-be73c78441f2
- DeepSurv: personalized treatment recommender system using a Cox proportional hazards deep neural network: https://bmcmedresmethodol.biomedcentral.com/articles/10.1186/s12874-018-0482-1
- Can Artificial Intelligence Help See Cancer in New, and Better, Ways?: https://www.cancer.gov/news-events/cancer-currents-blog/2022/artificial-intelligence-cancer-imaging
- auton-survival: an Open-Source Package for Regression, Counterfactual Estimation, Evaluation and Phenotyping with Censored Time-to-Event Data: https://www.cs.cmu.edu/~chiragn/papers/auton_survival.pdf
- The Cost of Fairness in AI: Evidence from E-Commerce: https://link.springer.com/article/10.1007/s12599-021-00716-w
- Fairness ideals in inventory allocation: https://onlinelibrary.wiley.com/doi/full/10.1111/deci.12540
- India Debates Skin-Tone Bias as Beauty Companies Alter Ads: https://www.nytimes.com/2020/06/28/world/asia/india-skin-color-unilever.html
- The Ethics of Realism in Virtual and Augmented Reality: https://www.frontiersin.org/articles/10.3389/frvir.2020.00001/full
- What are the risks of virtual reality and augmented reality, and what good practices does ANSES recommend?: https://www.anses.fr/en/content/what-are-risks-virtual-reality-and-augmented-reality-and-what-good-practices-does-anses
- Google Cloud Platform: Healthcare Solutions Playbook: https://cloud.nih.gov/resources/guides/science-at-cloud-providers/science-on-gcp/GCPHealthcareSolutionsPlaybook.pdf