Sustainable Model Life Cycle Management, Feature Stores, and Model Calibration
The primary objective of this chapter is to provide you with sustainability-related best practices that should be followed during the model development process. This aligns with the previous chapter, where we discussed organizational goals related to sustainable AI. Our aim is to encourage people across different levels of an organizational hierarchy to restructure the organizational roadmap and build trustworthy AI solutions. You will get an understanding of the importance of all aspects of AI ethics and the best practices that need to be followed. We will illustrate how to incorporate privacy, security, and sustainability in a feature store example.
In this chapter, you will learn how to improve model probability estimates to yield more accurate outcomes. We will look at adaptable systems in the context of sustainability.
By coupling sustainability with the concepts of model training and deployment, you will learn how to achieve sustainable, adaptable systems that facilitate collaboration and sharing. You will explore model calibration and learn about its importance when designing adaptable ethical AI solutions.
In this chapter, we will cover the following:
- Sustainable model development practices
- Explainability, privacy, and sustainability in feature stores
- Exploring model calibration
- Building sustainable, adaptable systems
Sustainable model development practices
Along with the ethical deployment of AI, sustainability helps us all to move one step closer to better ecological integrity and social justice. Throughout the process of building AI products – from idea generation to training, retuning, implementation, and governance – we should be aware of the environmental impact of our actions and AI solutions and ensure that they are friendly to future generations. When we consider the impact of our work using metrics, we work more responsibly and ethically. It is essential to have an organizational roadmap that describes best practices at each stage of model development so that change management is minimal and easy to track. This will also allow innovation in sustainable AI and compel organizations to hit CO2 emission targets for AI training, validation, deployment, and usage.
In the next subsection, we will explore how organizations, people, and processes can be oriented toward sustainable AI model development. This will help teams to deploy models that are successful in the long run.
First, let’s look at how guidelines for building sustainable, trustworthy frameworks can be set out by organizations.
Organizational standards for sustainable, trustworthy frameworks
In Chapter 3, we learned about regulations and policies surrounding trustworthy AI; the systems we deploy to production need to be 100% compliant with regulations. We have certain open source frameworks, as listed here, that can be reused and integrated into existing platforms:
- TensorFlow Model Remediation: This is a library developed by Google that aims to limit biases during model preprocessing training or postprocessing.
- TensorFlow Privacy: This is a library developed by Google that enables ML optimizers to optimize the objective function of ML models while incorporating differential privacy.
- AI Fairness 360: This is a library developed by IBM to detect and mitigate bias.
- Responsible AI Toolbox: This is a library developed by Microsoft to help access, develop, and deploy AI solutions ethically in a trustworthy environment.
- XAI: This is a library that facilitates model explainability through model evaluation and monitoring.
- TensorFlow Federated: This is a library to support distributed training involving multiple clients.
In addition, we need to know how to incorporate the best practices in existing technological platforms, which can act as pointers for the evaluation of trustworthy frameworks. Let’s summarize the common model governance and risk management activities that should be practiced by organizational leadership. To establish the best ethical and sustainable practices in the development and deployment life cycle, the questions listed in Figure 13.1 need to be answered:
|
Model practice |
Key questions |
|
Model development phase |
|
|
Identification |
Has the organization identified and listed key regulatory tools based on federal guidance? For example, for banking and insurance, certain financial and risk models need to be used to evaluate a framework. |
|
Inventorying |
What is the model inventorying strategy? For example, is there a model classification process in place during the model development life cycle? Have different risks been accounted for, and how has this affected the ranking of the different models? |
|
Naming policy and security |
How is the model namespace managed? Does it take into consideration the domain problem as well as the business use case? How are the key stakeholders involved in model version control and security management? |
|
Formalized policy and procedure |
Are there proper guidelines, audit checklists, and authorized personnel involved in formalizing the standards and guidelines for model development, validation, use, monitoring, and retirement? |
|
Compliance |
Is there a regulatory requirements checklist? Are there frequent audits for regulatory requirements? Are there trained personnel involved who work closely with ML, data engineering, and analytics teams to verify that all enterprise systems abide by confirmation and compliance? |
|
Research and the application of best practices |
Are there initiatives to deep dive and conduct research based on the problem that the model is serving? Are there properly trained personnel assigned to research and disseminate the current model’s best (standard) practices? |
|
Documentation |
Are there well-documented models within the scope of the problem definition and business objectives? Are there definitions of feature stores and established communication processes when teams share and reuse features, models, and data? How do we ensure data and model availability without violating security, while ensuring awareness among team members? |
|
Sharing and reuse |
How are ML models and features shared in centralized and Federated Learning (FL)? How are built-in security, privacy, and notification strategies incorporated for feature updates across teams? |
|
Model validation phase |
|
|
Testing and validation |
How is the unit testing of models and system testing incorporated when models are put in place in the serving framework? What are the interventions and supervision techniques employed to ensure formal model validation procedures, along with the model-serving APIs? What are the guidelines and practices that are in place to certify model interoperability across platforms? What emission metrics have been considered? |
|
Challenge/effective criticism |
How are reviews/challenges encountered in model input, output, training, validation, and testing processes addressed? What agile processes are in place to incorporate incremental model changes to ensure that a model is accurate and, at the same time, private, fair, and interpretable? |
|
Model implementation phase |
|
|
Implementation and use of governance |
What are the standard operating procedures in place for models, with special reference to refreshes, queries, the use of links, data dumps, and the handling of input identification? Are the recommended practices for shared control tools being followed? Have shared techniques for users, such as watch windows, balance checks, and backups, been established? |
|
Ongoing monitoring of models |
|
|
Remediation |
Is there the right sort of model tracking for remediation and the correction of errors? Are there defined metrics in place for sustainability across platforms, ML models, and data pipelines? |
|
Change management |
How are model changes tracked and updated in documents? |
|
Auditing and reviewing |
Are the best audit and review processes established to validate lines of defense and ensure the quality of model output? How have benchmarks been established to differentiate and scale models in larger enterprise-grade platforms? How will we effectively control costs from our benchmarks across different client platforms? |
|
Definition of risk tolerance, appetite, and risk thresholds |
What are the different threshold levels of model acceptance? Have we formulated a risk tolerance level based on the problem scope, domain, and volume of data that can be accepted within certain margins of uncertainty? Are we maintaining and establishing financial impact/dollar variances relative to the expectation of each of the models? |
|
Identifying secondary risks |
What are the techniques to assess risks arising out of managing other risks, such as delays in meeting a deadline or disrupting data schema? |
|
Identifying operational risks |
How do we define operational risks in which a model is implemented? Does this involve the consideration and periodic review of different features, such as the discount rate, or ensure the validation of operational procedures, such as version control? |
|
Identifying emerging risks |
What are the new or potential emerging risks due to continuous refreshes of models over time? |
|
Tracking |
What are the steps for model tracking for traditional-based, deep learning-based, and FL-based models? How do the tracking steps allow revisions and provide room for additional use throughout the entire model life cycle? |
|
Ongoing monitoring |
What monitoring tools and dashboards are in place to allow periodic monitoring over time of accuracy, relevance, and interpretability? How are model interpretability tools used to communicate to business stakeholders about business model risks, data, and concept drift? |
|
AI application usage |
|
|
Terms and conditions for licenses, terms of use, and click-thrus |
What audit processes do we have to validate licenses, terms of use, and warranties? How do we ensure the proper usage of AI applications by including language dissuading the usage or liability of unintended applications? For example, allowing waivers for any use of life-saving equipment, mission-critical avionics, military applications, or munitions, and at the same time disavowing export to or use in embargoed countries. |
Table 13.1 – Key model practices and questions
Each business unit needs to answer the preceding questions to ensure the proper alignment of modeling processes to corporate strategies. This, in turn, helps organizations to become aware of sustainability practices and directs their focus to data and model development and governance strategies. Overall, the aim is to facilitate reuse and coordination in an environmentally friendly way. Hence, we need a unified model of chain management that prevents the potential misuse of ML models by increasing transparency and interpretability and reducing key-person dependence. It is also highly important to set the foundations on which the board of directors governs a corporation and the ethical boundaries under which the CxO office operates. CxO (where CxO refers to the roles of CEO, CTO, and CIO) initiatives that structure and drive the aforementioned processes under the purview of data teams are key to the success of any AI-driven business. Using such initiatives, we can not only increase profit margins by several percentage points but also save billions of dollars by using resources judiciously and employing trained data teams.
Organizations that fail to answer the preceding questions and establish the required processes suffer from time and monetary losses. In addition, they fail to sustain their AI-driven business use cases in this competitive world.
Having understood this, we can now move on to looking at feature stores.
Explainability, privacy, and sustainability in feature stores
In Chapter 10, we introduced the concept of feature stores and demonstrated with an example how online feature stores can be used. Furthermore, in the previous section, we learned about the important aspects of sustainable model training and deployment and the best practices for tracking sustainable model metrics across different cloud providers. We also saw in Chapter 12 that FL provides a training environment to allow sustainability, by allowing the local training of devices. Hence, we must try to leverage FL in training ML models in healthcare, retail, banking, and other industry verticals in scenarios where generic model representation plays an important role as computational power is limited.
In this section, let’s dig deeper into creating explainable, private, and sustainable feature stores.
Feature store components and functionalities
Let’s now explore how the different components of a feature store serve their functional roles in a distributed architecture, as shown in Figure 13.1:
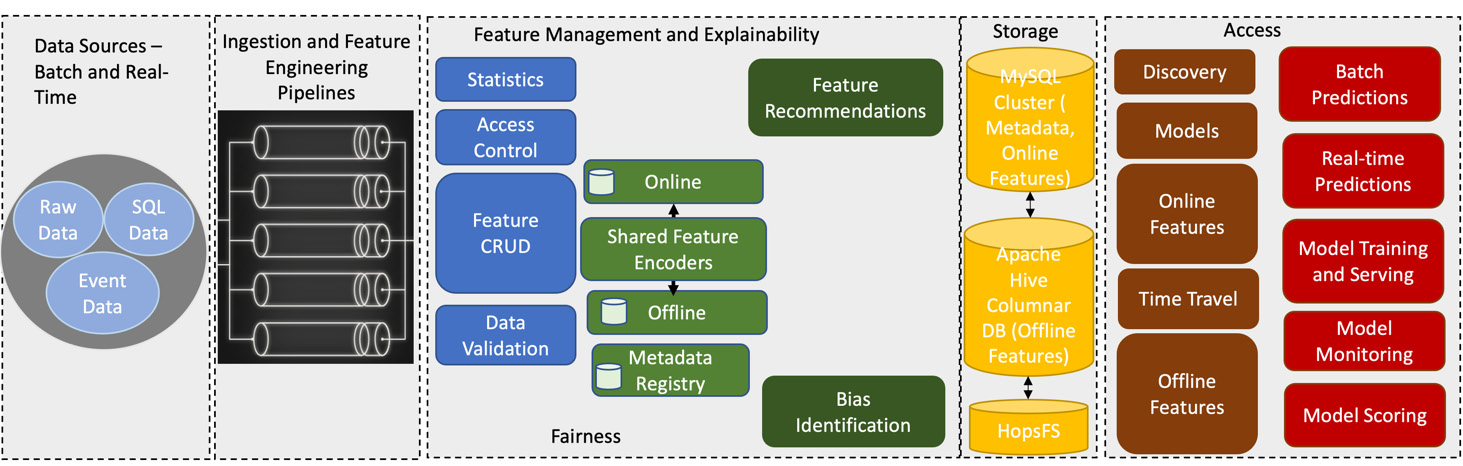
Figure 13.1 – The different components of an ethical feature store
The following list looks at each component in more detail:
- The first component is the data source unit, where data can be received and aggregated from third-party sources. The data can be raw data, SQL data, or event data. To build sustainable ML models and feature stores, we need to have FL capabilities built into the infrastructure, where the data is mostly event data from mobile devices, IoT devices, or Internet of Medical Things (IoMTs). FL definitely provides us with an opportunity to practice sustainable model development. However, without FL, having an automated feedback loop with re-training capabilities can also help us to create sustainable ML models.
- The second component comprises the ingestion and feature engineering pipelines, where data needs to be anonymized to protect Personally Identifiable Information (PII), which we discussed in Chapter 2. To highlight and build sustainable pipelines, we must support reuse in our design to extract relevant features that can be used across teams. In addition, to support federated collaboration-based learning methodologies and deployment strategies, feature engineering pipelines should be distributed across cloud and edge devices. This will help to distribute load and control the emission rates of centralized training procedures. For example, Figure 13.2 illustrates a working methodology of FL in edge networks using Deep Neural Networks (DNNs). We have also shown different kinds of cloud services (from Google Cloud Platform) that can be used in the server component.
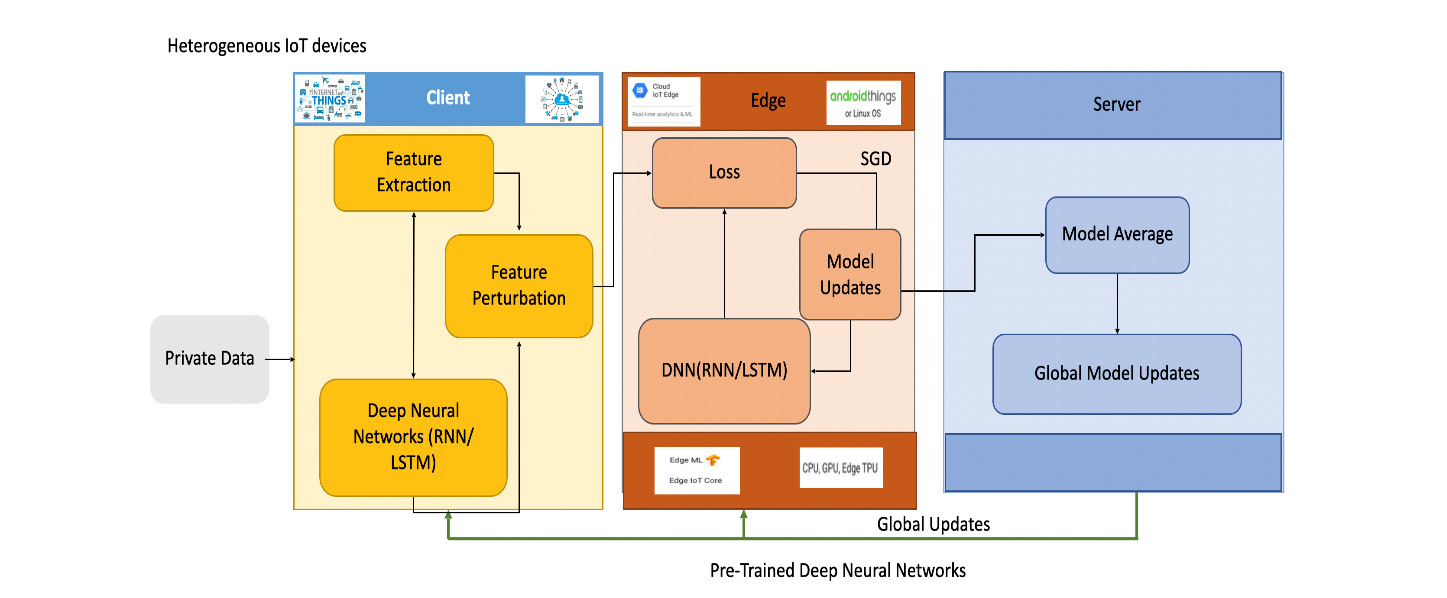
Figure 13.2 – FL in edge networks
In the preceding figure, Figure 13.2, the client aggregates data from numerous IoT devices and engages in local deep learning-based model training, while a few servers deployed at several edges are responsible for the first level of model aggregation, which ultimately gets aggregated in the cloud. The aggregated model is then pushed to the edges, and local clients continue with training on their local datasets.
- The third component involves feature management and explainability for online and offline processing. In Chapter 4, we discussed how we can create sandbox environments or isolation units through the use of appropriate security rules to process and store features as required by different teams with different levels of sensitivity (refer to Figure 4.12 in Chapter 4). This component is also engaged in satisfying the pillars of AI ethics that govern feature explainability, bias identification, and feature recommendations. The fairness side of data and features also needs to be satisfied by this component, as biased datasets and extracted features can lead to biased ML models.
- The fourth component is storage, where metadata, online, and offline features can be stored. This includes both SQL and NoSQL databases and the cache, where storage can be maintained on disk as well as in memory for fast retrieval.
- The fifth component involves the ways that users can perform time-travel queries that execute high-speed searches to return data at a given point in time (where we can learn about the history of the data and record its lineage), the data for a given time interval, and the changes made to data since a given point in time. Time-travel queries are executed efficiently using indexes (bloom filters, z-indexes, and data-skipping indexes), which deserve special mention, as they reduce the amount of data that needs to be read from a filesystem or object store.
- The final component (along with model training, deployment, and monitoring) is also responsible for identifying model drift. With access privileges set on individual models, this component promotes the comparison of model scoring metrics in order to take quick action on model re-training.
Next, let’s move on to learning about feature stores for FL.
Feature stores for FL
We saw how feature stores play an important role in ML model reuse and features for centralized learning in Chapter 10. Now, let’s investigate how we can leverage some of the existing concepts of feature store pipelines for collaborative learning, as in the case of FL frameworks. This will facilitate the development and deployment of federated tools, allowing the technical teams of organizations, educational institutes, and partners to come together and share data, ML models, and their features.
We will see how FeatureCloud AI Store for FL (primarily built for biomedical research) can be used across other domains by providing a platform to unify a set of ready-to-use apps.
Figure 13.3 demonstrates the different components of FeatureCloud, explaining how collaborating parties can work together to create a certified feature store in the cloud that can include new third-party apps:
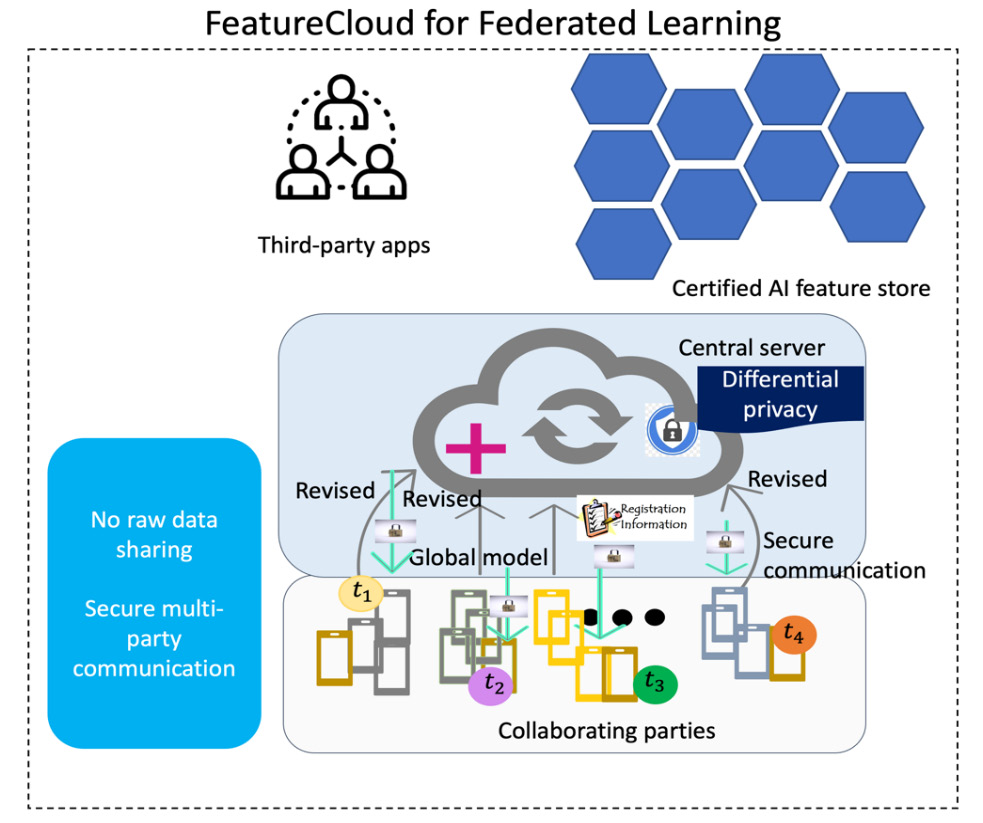
Figure 13.3 – A private FeatureCloud store for FL
These unified federated apps can yield similar results to centralized ML in scalable platforms. With increased collaboration, built-in privacy mechanisms such as homomorphic encryption, secure multi-party computation, and differential privacy become of great importance, as they protect sensitive information. FeatureCloud AI Store is a feature store that removes the restrictions of conventional FL-based modeling by redefining the Application Programming Interface (API), making it easier for developers to reuse and share novel apps from external developers. Along with an open API system, it has the support of deployment distribution, allowing the use of algorithms through configurable workflows. The feature store is transparent and open to external developers, who are free to add and publish their own federated apps, making the system an efficient collaboration medium for data, models, and apps.
The app interface available in the third-party apps, as shown in the preceding figure, provides detailed information on the different categories of apps by displaying basic information about them, including short descriptions, keywords, user ratings, and certification status. In addition, each app – as well as being classified into either preprocessing, analysis, or evaluation – is equipped with a graphical frontend or a simple configuration file to set app parameters and adapt them to different contexts.
Any app that is part of FeatureCloud runs inside a Docker container, which can exchange data and other essential information with other apps using the FeatureCloud API. The stores accelerate the development of federated applications by providing a template and a test simulator for testing.
This kind of shared app environment comes with app documentation, search and filter functionality, and an app certification process to promote privacy standards in the AI store. The certification process enforces strong guidelines about testing frequently for privacy leaks; the failure of these tests leads to a notification for concerned developers to address the issue. However, it also comes with a functionality whereby a new certification process is issued whenever an application is updated.
One key drawback of this kind of collaborative, sustainable platform is that the coordinator has access to all the individual models before aggregating them. Hence, the framework comes with different privacy measures, such as secure multi-party computation and differential privacy, to handle any privacy leaks.
A federated workflow can be designed by bringing in all collaborating partners that download and start the client-side FeatureCloud controller on their machines using Docker. The coordination can be smoothly established across user apps from the AI store, as users can create an account on the FeatureCloud website. It facilitates cross-institutional data and algorithm sharing and analysis by integrating Cross-Validation (CV), standardization, model training, and model evaluation procedures through separate apps in the workflow, as shown in Figure 13.4:
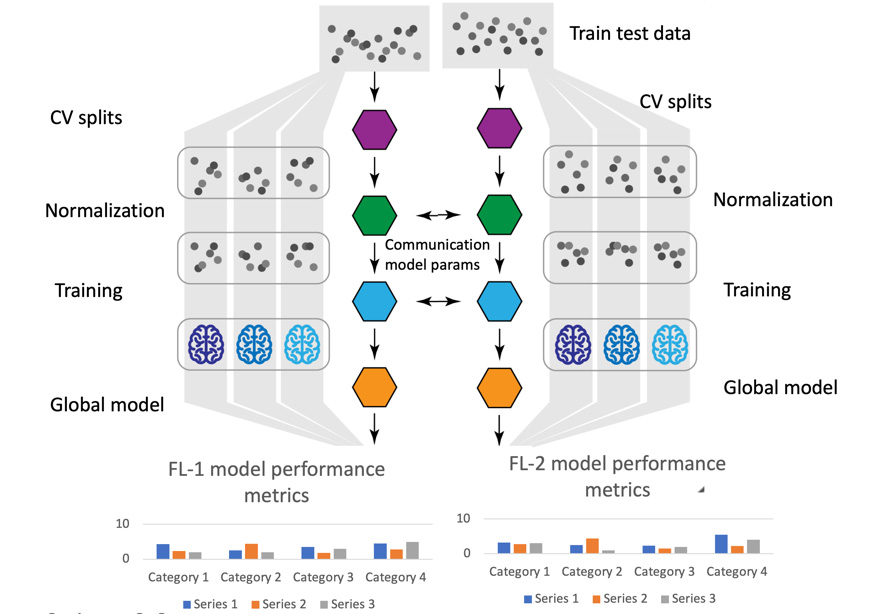
Figure 13.4 – A FeatureCloud workflow using app-based FL
As multiple apps form a workflow, the consecutive execution of those apps one after the other completes the running of a unique workflow. Outputs or results from one application can be consumed by another application, and the overall workflow progress can be tracked or monitored. The results from the workflow can be shared among the participating entities to understand and evaluate each step of the overall modeling process. FeatureCloud can solve practical problems in biomedicine and other domains.
Now that we understand how FeatureCloud operates, let’s try to understand some of its important properties.
The properties of FeatureCloud
Here, we will learn how a collaborative cloud environment created through a set of apps in a federated setup can help us to serve better workflows:
- FeatureCloud offers different combinations of ML algorithms to solve common problems, by efficiently utilizing them from apps in the AI store or app templates.
- It uses a common standardized data format that offers an easy way to compose apps in a workflow, from data ingestion and mutual data consumption to the generation of the output.
- It drives collaborative research to serve broader objectives by bringing in less-experienced developers as well as experienced professionals to create customized workflows.
In this section, we learned about concepts related to federated feature stores that are ethically compliant. Now, let’s learn how to enhance predictability in AI/ML-governed systems by determining the likelihood of predictions for different classes. This will help us to design realistic systems with minimal drift.
So, let’s explore model calibration, a postprocessing technique that not only improves model probability estimates but also helps to create sustainable, robust model predictions.
Exploring model calibration
Calibration is a model postprocessing technique that is used to improve probability estimates. The objective is to improve a model in such a way that the distribution and behaviors of the predicted and observed probabilities match.
Model calibration is required for mission-critical applications where the likelihood of a data point being associated with a class is very important – for instance, building a model to predict the likelihood of an individual being ill.
Let’s try to understand calibration better with the help of a classic cat-dog classifier example.
Let’s assume we’re working with a cat-dog classifier where all the input images are only cats or dogs. Now, if a model thinks that the input image is of a cat, it outputs 1; conversely, if it thinks that the input image is of a dog, it outputs 0. Our models are essentially continuous mapping functions – that is, they output values between 0 and 1. This can be achieved mathematically, using approaches such as having a sigmoid function as the activation function in the final layer. A good classifier is likely to produce scores near 1 for cats and scores near 0 for dogs.
But are these scores between 0 and 1 representative of actual probabilities?

Figure 13.5 – A cat-dog classifier example
Does the score of 0.18 in the preceding figure mean that 18% of the input image is a cat? If a model is well calibrated, then hypothetically, yes! We can interpret its results as probabilities. The main concern is how to determine whether our model is well calibrated. Consider another real-life example – looking outside to see a storm brewing when the probability of rain given by your weather app is less than 5%. This happens when a model is not well calibrated and, thus, performs poorly. Let’s look at how to determine whether a model is well calibrated.
Determining whether a model is well calibrated
Referring to the previous example of the cat-dog classifier, in order to understand whether these numbers can be seen as probabilities, we need to plot a reliability graph. In a reliability graph, the x axis plots the score given by the model – that is, the predicted probabilities of the positive class (in our example, the cat class). Whenever an image is received, it will be put in the correct bracket based on the score provided by the model – for instance, if the image has a score of 0.9, it will be placed in the 0.8 to 1 bracket, where the model presumes that it is more likely to be an image of a cat. For an image score of 0.06, the image will be placed in the 0 to 0.2 bracket, for images that are very likely to be of a dog. We can continue in this manner for many images and keep populating our graph. Once have added a large number of images, we can look at the y axis, which plots the number of images that are actually of cats; in other words, the y axis represents the actual frequencies of the positive class. For a well-calibrated classifier, the points will be close to the diagonal line.
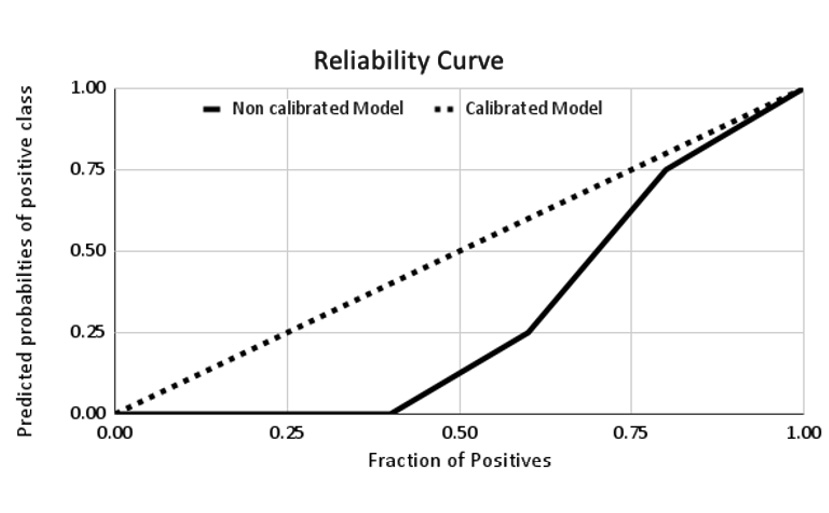
Figure 13.6 – The scores output by the model and the proportion of images that were actually of cats
The preceding graph shows an example of a poorly calibrated model. For the range of 0.4 to 0.6, if the score truly represented a probability, then there would be a 40–60% chance of any particular image in the stack being of a cat. However, we only see a 25% chance of an image being of a cat in this bracket; this indicates a poorly calibrated model.
Calibration applies to both classification and regression tasks. Here, we have discussed an example of a classification task. In regression tasks, we focus on estimating the probability distribution of the predicted values. The calibrated regressor model defines the mean prediction, and the expected distribution around this mean value reflects the uncertainty associated with the prediction.
Before delving into different calibration techniques, let’s first understand why miscalibration occurs.
Why miscalibration occurs
Miscalibration is a common problem for ML models that are not trained using a probabilistic framework and where there is bias in the training data. In most scenarios, an inherent characteristic of a model is responsible for whether that model ends up being calibrated or not. In the case of logistic regression, we leverage the loss function; hence, no additional post-training is required. This is due to the fact that the probabilities generated by it are calibrated in advance. The independence assumption in Gaussian Naive Bayes can cause poorly calibrated probability estimates, nudging them close to 0 or 1. Nonetheless, in the case of a random forest classifier, values near 0 or 1 are rarely achieved, since an average of multiple inner decision trees is calculated. The only surefire way to accomplish 0 or 1 is when each model returns a value near 0 or 1, which is an intriguing occasion from a probability perspective.
Let’s now learn about various calibration techniques.
Calibration techniques
Some classification models, such as Support Vector Machines (SVMs), k-nearest neighbors, and decision trees, either do not provide probability scores or give poor estimates. Such approaches need to be coerced into giving a probability-like score, and thus, calibration prior to usage is required.
Platt scaling and isotonic regression are two of the most prominent calibration techniques in use. Both of these approaches transform the output of the model into a likelihood score and, hence, calibrate it. We will study these techniques in the following sections.
Platt scaling
The principle of this technique involves the transformation of classification model output into a probability distribution. Put simply, Platt scaling is used when a calibration plot looks like a sigmoid curve and is efficient for small datasets.
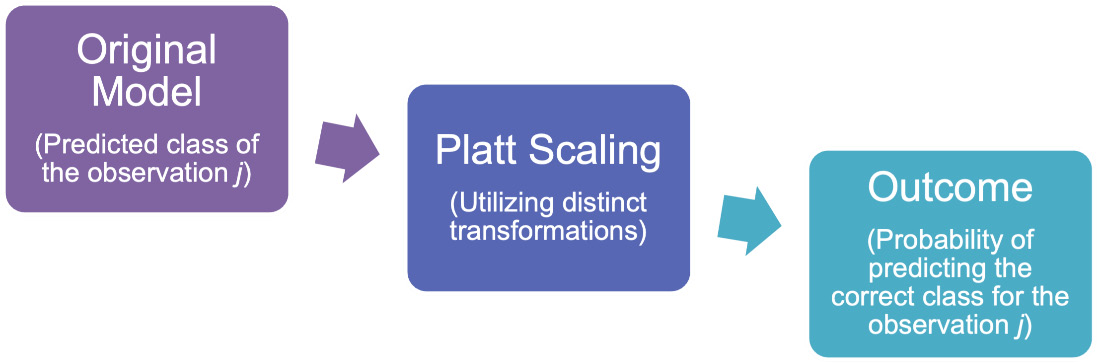
Figure 13.7 – Platt scaling illustration
Platt scaling is a modified sigmoid function and solves an optimization problem to get A and B. It returns a degree of certainty about the actual outcome instead of returning class labels. With classification models such as SVM, as discussed previously, we utilize particular transformation techniques in order to calibrate our model and obtain a probability as the outcome.
Isotonic regression
Compared to Platt scaling, isotonic regression is a more powerful calibration technique that is capable of correcting any monotonic distortion. It is used when a calibration plot does not look like a sigmoid curve. Isotonic regression breaks a curve into multiple linear models and, hence, requires more points than Platt scaling. This technique tries to find the best set of predictions that are non-decreasing and are as close as possible to the primal (original data) points. The approach entails implementing regression on the primal, or original, calibration curve when applied to the issue of calibration. Unlike Platt scaling, isotonic regression is not recommended for small datasets to avoid overfitting and is intended to be used on large datasets, due to its outlier sensitivity.
Next, we will see, with a hands-on example, how model calibration can affect model reliability.
Model calibration using scikit-learn
In this section, we will use the scikit-learn module to synthetically create data to compare the reliability and performance of uncalibrated and calibrated models. This is how we do this:
- As a first step, we import all the necessary modules. Here, we will be using scikit-learn both for synthetic data generation and to build classifiers – both uncalibrated and calibrated:
- Here, we first consider a balanced dataset. The following statement generates 10,000 samples, each with 10 features, and equal distribution for the two classes:
For convenience, we will put the features and labels in respective DataFrames:
- Now, let’s verify whether the data is balanced or not using the following code:
In the following plot, you can see equal distribution of the labels:
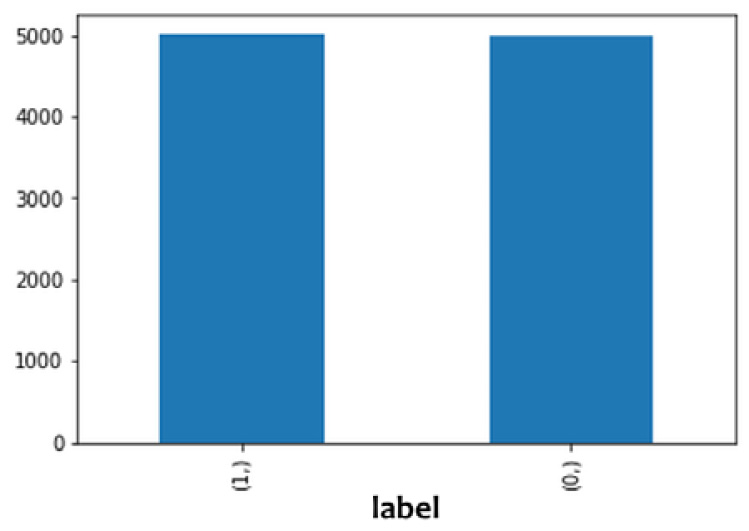
Figure 13.8 – A bar chart showing class distribution in the synthetic data
- Next, we split our data into training, validation, and test datasets with a ratio of 60:20:20:
Then, we train a simple logistic regression classifier on the training dataset:
Let’s see the performance of our classifier using the area under the curve metric:
The auc value of our classifier is 0.92 – not bad!
We also check our classifier performance using the Brier score. It is a measure of the accuracy of probabilistic predictions, mathematically expressed as follows:
Brier score = 1N∑i = 1Np(yi) − o(yi)2
Here, N is the number of instances, p(yi) is the predicted probability that an instance, i, belongs to the yi class, and o(yi) is the actual outcome of the instance, i, with o(yi) = 1 if yi is the true class and o(yi) = 0 otherwise:
The Brier score ranges from 0 to 1, with a score of 0 indicating perfect accuracy and a score of 1 indicating the worst possible performance. Our classifier shows a Brier score of 0.11, again a good performance.
Let’s now repeat the process for a calibrated classifier, for the same balanced dataset:
From both the accuracy and Brier score values, we can see that for the balanced dataset, the uncalibrated classifier is as good as the calibrated classifier:
The following plotted reliability curves confirm this:
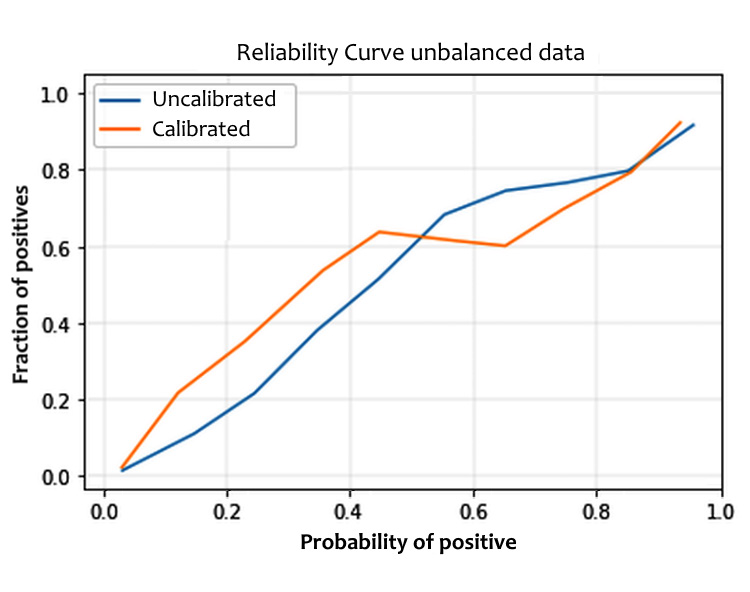
Figure 13.9 – A reliability curve for balanced data
Let’s now repeat the process for an imbalanced dataset:
We can verify that the classes are highly imbalanced by plotting the frequency chart for labels:
Here is the plot for it:
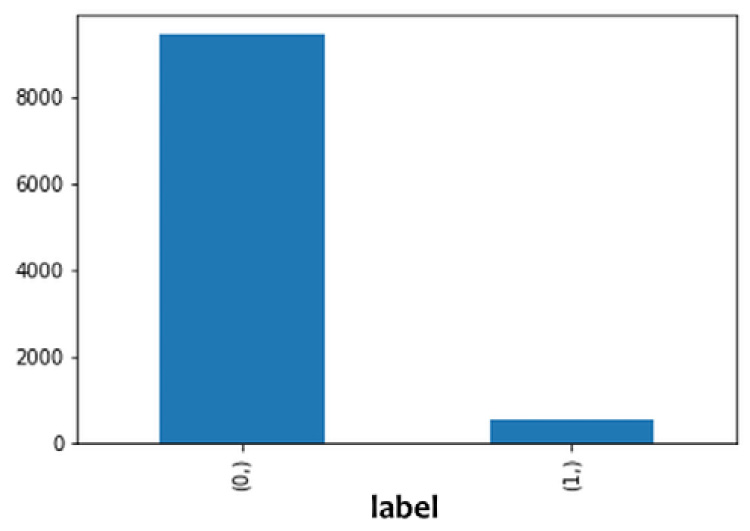
Figure 13.10 – A bar chart showing class distribution in the synthetic data
As before, we split the dataset into training, validation, and test datasets with a 60:20:20 ratio:
Now, we explore the uncalibrated model:
And finally, we explore the calibrated model:
Here is the graph for it:
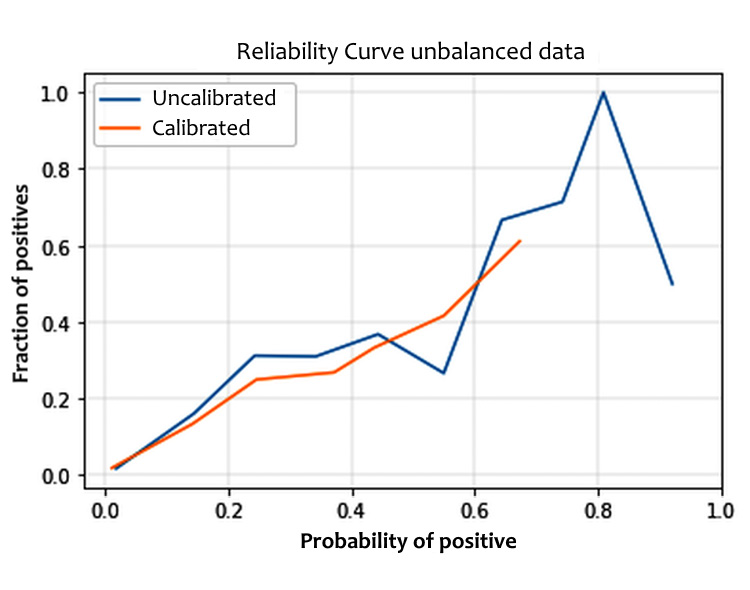
Figure 13.11 – A reliability curve for unbalanced data
We can see that calibrated models give a more reliable prediction compared to the uncalibrated model for unbalanced data.
Let’s now explore how to design adaptable systems by considering dynamic calibration curves.
Building sustainable, adaptable systems
We have looked at the step-by-step processes for model governance and sustainable model training and deployment. We also now understand how important it is to build reusable feature stores.
We understand that without a feature store, we will end up with a separate feature engineering pipeline for each model that we want to deploy. Duplicate pipelines inevitably lead to added compute costs and data lineage overheads, as well as lots of engineering effort. However, the endeavor of building a sustainable feature store will be fruitless if it’s not robust and resilient enough to adapt to data and concept drift.
Even when we design large-scale distributed ML systems, we should think about building an adaptable system with the ability to detect data drift, concept drift, and calibration drift. This will facilitate continuous monitoring and mean that we can manage new, incoming data from different sources. For example, in a retail system, we may encounter new customers with varied buying patterns, while in a healthcare system, we might see new patients with new diseases coming into the system. To build adaptable systems that can deal with continuous change, we must understand how calibration and dynamic calibration curves help us to detect and improve model performance. While calibration curves provide diagrammatic representations of model performance across a range of predicted probabilities, dynamic calibration curves help us to visualize the development of true calibration curves over a time series by considering each observation in place. Furthermore, a dynamic curve, by representing the weighted distribution of predicted probabilities, helps us to estimate the fitted values on an evaluation set. This kind of fitting helps to evaluate the performance of the fitted curve. You can read more about this here: https://www.sciencedirect.com/science/article/pii/S1532046420302392.
The feature stores we build should have automation built in to support dynamic calibration curves and evaluate changes in model performance from new observations. Feature store drift detectors can alert teams about miscalibration as new data accumulates and, furthermore, automate the re-training process using the recent data window. Most importantly, if we can accurately detect drift in time series, and the trends seem to be permanent, then we should also see a change in calibration.
MLOps teams should be cautious of the speed and magnitude of calibration drift once it begins, which can be efficiently detected by accurate monitoring systems. The change should come from a relatively high number of observations to give us confidence that there is indeed a transition from a calibrated to a miscalibrated model.
Dynamic calibration curves are not strong enough to learn miscalibration in low-density, high-probability ranges, due to limited knowledge in the concerned probability area.
Figure 13.12 illustrates a dynamic calibration curve, specifically how its response evolves over a period due to changes in model performance.
By miscalibration (et ), we mean the deviation of the curve from the ideal calibration, which is obtained by computing the absolute difference between an observation’s predicted probability (pt) and the fitted value of the current curve at the predicted probability (https://www.sciencedirect.com/science/article/pii/S1532046420302392).
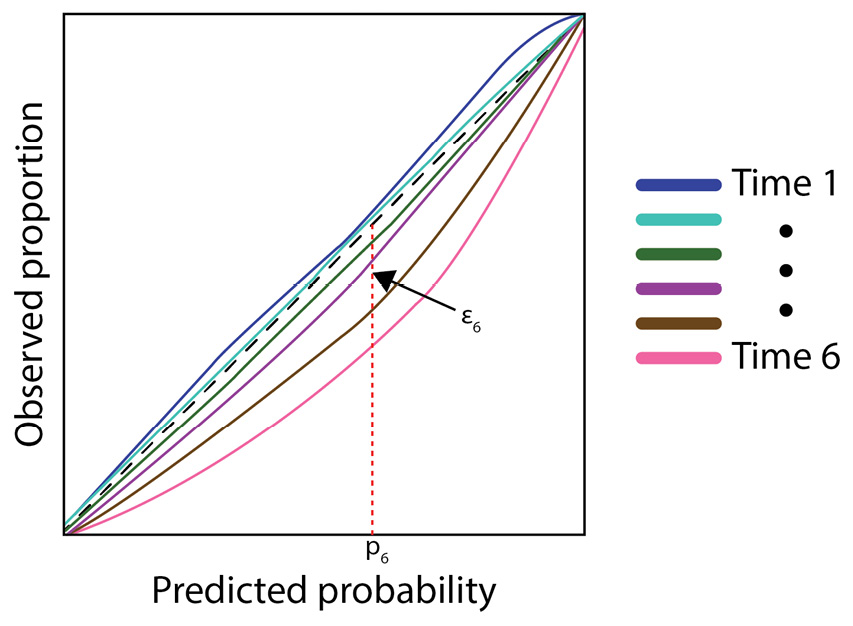
Figure 13.12 – Dynamic calibration curves over a period
Some important areas of focus to detect calibration drift that necessitates model updates are listed here:
- A dynamic calibration curve should aim to showcase performance degradation, even without highlighting the specific degradation.
- Miscalibrations can exhibit fluctuations between over-prediction and under-prediction zones, with a wide boundary of probability. This is further signified by calibration errors varying before and after drift.
- Calibration drift often results from transitional states.
- Variance in dynamic calibration curves can be handled by tweaking the step size, or initial learning rate, of the Adam optimizer (a deep learning optimizer used for the first-order, gradient-based optimization of stochastic objective functions) to quickly respond to changes in model performance.
- Significance margins for model performance need to be properly set and defined for very small changes in calibration.
- Based on model complexity, the minimum window size needs to be defined to capture sufficient samples for model updates.
As you can see in Figure 13.13, the online and offline feature spaces are shared to create a combined shared feature called encoders. Refer to the following figure:
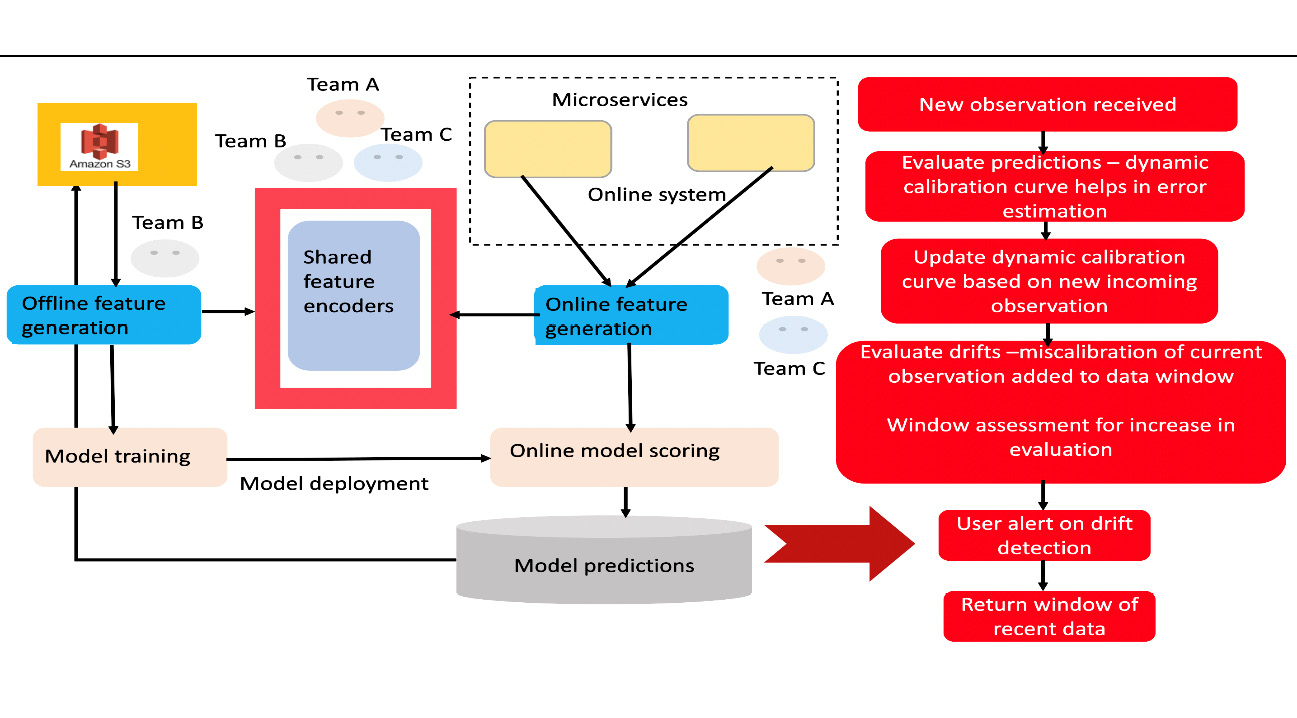
Figure 13.13 – The importance of a calibration drift detector in feature stores
While Team B contributes to the offline feature generation process, Team A and Team C take part in the online feature generation process. If a sudden change in any of the online features triggers a calibration drift and harms the model’s performance, there must be an immediate alert triggered to Team B, as that team also accesses the shared feature space. A model trained using the shared features of Team B can also experience calibration drift and must take immediate corrective action by triggering re-training.
Here, we observe the importance of a calibration drift detection algorithm for running and triggering alerts.
In addition to calibration drift, we studied in Chapter 7 how data and concept drift play an important role and how adaptable frameworks have evolved to handle those kinds of drift. Now, it is also important that we broaden our scope to apply that in the context of sustainable training environments and incorporate adaptable frameworks in feature stores. We have learned about sustainable feature stores; now, let’s integrate the idea of concept drift into FL environments.
Concept drift-aware federated averaging (CDA-FedAvg)
We have seen in FL design patterns that the asynchronous method of sending model updates serves power-hungry devices well, giving them the flexibility to participate in training whenever they have power available. It also aids in concept drift detection and adaptation techniques in a collaborative environment, with the server orchestrating the process.
The server acts as an orchestrator to aggregate models from individual devices, and the local devices become the deciding body to select the data and the time to trigger the process of local training.
The model aggregated by the central server is globally agreed upon (each individual model from the participating entities is agreed upon and averaged by the server), and the server broadcasts it to all the clients. The clients become responsible for detecting and handling changes in data and model patterns. The clients train the models on their local training datasets and manage drift in a three-stage process:
- Timing-based drift identification
- Drift Root Cause Analysis (RCA) to identify the cause of the drift and the data instance where it starts to occur
- Response and mitigation methodology to adapt drift to yield high-accuracy models
As clients are exposed to newly collected data from several input sources, they are equipped with drift detection algorithms to identify new concepts (drift detection) and learn from them. The drift adaptation techniques built in help to analyze how the data or model differs between two timestamps, as well as analyzing the drift’s nature or what causes it, taking remedial actions accordingly. The local clients are equipped with short-term memory and long-term memory to respond to drift as soon as it is detected. While short-term memory helps to store and compare data instances collected by the client in the latest time interval, long-term memory stores data samples for events or concepts that were old and appeared in previous instances, as compared to a current point in time.
This kind of adaptation with short-term and long-term memory helps us to understand data, model patterns, and concepts and trigger model training or re-training locally, by storing data records over a long period. This process happens in a sequence of events, as shown in Figure 13.14:
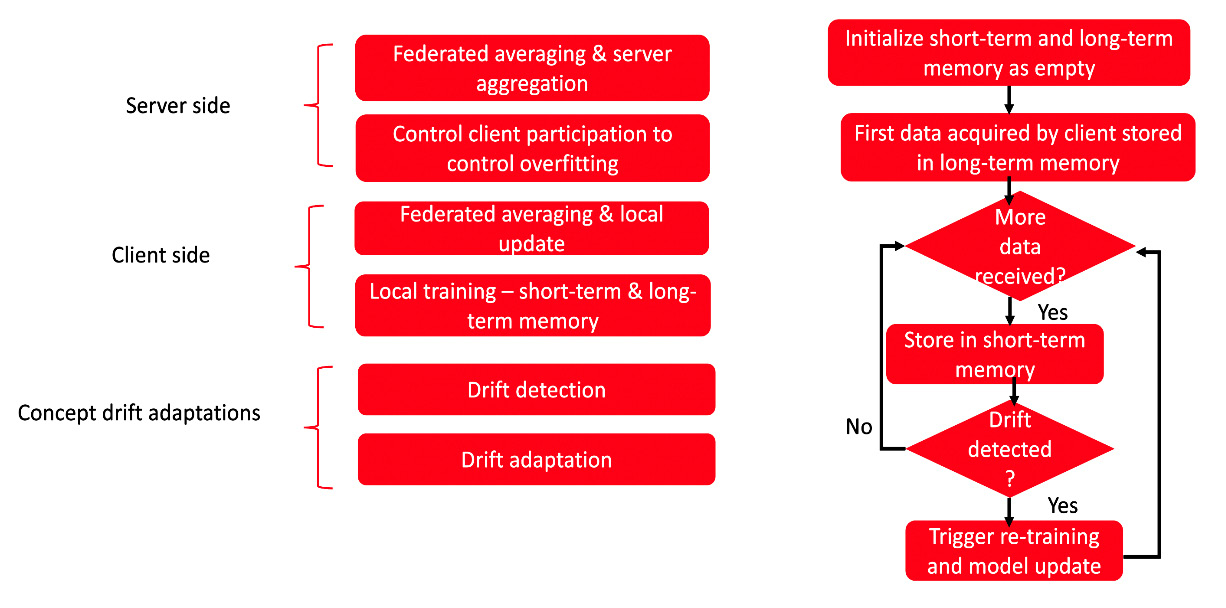
Figure 13.14 – CDA-FedAvg in FL clients
As shown in the preceding figure, we take actions based on the presence or absence of drift in the following manner:
- Both short-term and long-term memory are initialized as empty when the local training process has not kicked off yet.
- Once the client acquires the first data, it gets stored in long-term memory as the initial concept and is used for the first training and local update.
- Any subsequent data received by the client is stored in short-term memory to evaluate drift.
- Upon identification of potential drift, the new data acquired that’s relevant to the new concept gets stored in long-term memory.
- In addition, a new case of drift triggers a new round of training at the client’s end.
Thus, a well-designed system should not only run the best concept drift detection algorithm, whether in a centralized or FL environment, but also should be well calibrated to experience minimal drift due to changes in input data.
Summary
In this chapter, we have learned about the main guiding principles that leadership and stakeholders should use to take direct action to enable the best model-building practices in their organizational culture. This chapter gave us a deep insight into how to make the best use of FL in designing federated feature stores to encourage collaborative research through the use of APIs. In addition, we explored the concept of adaptable frameworks in feature stores that are also ethically compliant concerning privacy, interpretability, and fairness.
Furthermore, we learned how, with the help of calibration, to improve a model when its output suggests that it has regions of high probabilities, which may not be authentic. Metrics that take the prediction score as input can also be taken into consideration – for instance, the Area Under the Curve-Receiver Operating Characteristics (AUC-ROC) score is based on positioning predictions, but it falls short when it comes to accurately calibrated probabilities.
Calibration is advantageous in complex ML systems and real-world scenarios. It modifies the results of ML models after training and preserves the consistency of the output. Performing calibration can affect model accuracy, and in general, it is observed that calibrated models tend to be slightly less accurate than uncalibrated ones. However, this detrimental effect on accuracy is extremely low, and the advantages calibration offers are much more significant. Calibrating a model is a crucial step in improving prediction performance if a model’s objective is to achieve good probability prediction.
In this chapter, we identified the sustainability aspects of ethical models and how FL and federated feature stores can be hooked together, with sustainable energy solutions, to compute and control carbon emissions. After gaining a thorough understanding of the best design frameworks for ethical ML modeling, in the next chapter, let’s study how to apply these patterns in different domains to solve real-world use cases.
Further reading
- The FeatureCloud AI Store for Federated Learning in Biomedicine and Beyond: https://arxiv.org/pdf/2105.05734.pdf
- Detection of calibration drift in clinical prediction models to inform model updating: https://www.sciencedirect.com/science/article/pii/S1532046420302392
- Calibration Techniques and it’s importance in Machine Learning: https://kingsubham27.medium.com/calibration-techniques-and-its-importance-in-machine-learning-71bec997b661
- Calibration, Imbalanced Data: https://amueller.github.io/aml/04-model-evaluation/11-calibration.html
- Brier Score: Understanding Model Calibration: https://neptune.ai/blog/brier-score-and-model-calibration
- How to Calibrate Probabilities for Imbalanced Classification: https://machinelearningmastery.com/probability-calibration-for-imbalanced-classification/
- Classifier calibration: https://towardsdatascience.com/classifier-calibration-7d0be1e05452
- Why model calibration matters and how to achieve it: https://www.unofficialgoogledatascience.com/2021/04/why-model-calibration-matters-and-how.html
- What does model calibration mean in ML in Python: https://www.projectpro.io/recipes/what-does-model-calibration-mean
- A guide to model calibration: https://wttech.blog/blog/2021/a-guide-to-model-calibration/
- Calibration in Machine Learning: https://medium.com/analytics-vidhya/calibration-in-machine-learning-e7972ac93555
- Prediction & Calibration Techniques to Optimize Performance of Machine Learning Models: https://towardsdatascience.com/calibration-techniques-of-machine-learning-models-d4f1a9c7a9cf